


Can Marks And Spencer Group (LSE:MKS) Justify Its Valuation As Free Cash Flow Improves?
Recent commentary around Marks and Spencer Group (LSE:MKS) has zeroed in on one thing. The retailer’s push into store rotation, logistics, and technology is now being linked directly to its long term free cash flow story.
At £4.107 per share, Marks and Spencer Group has seen a clear upswing in momentum, with a 1 month share price return of 8.36% and a year to date share price gain of 25.10% that sits on top of a 3 year total shareholder return of 90.78%. This suggests recent enthusiasm around its store and logistics investments is being layered onto an already strong longer term recovery story.
Scan other retailers showing similar free cash flow momentum and balance sheet support by reviewing the curated 8 high quality undervalued stocks that share some of Marks and Spencer Group's key traits.
The recent jump in Marks and Spencer Group shares makes the timing question unavoidable. Does paying £4.107 today still stack up on the cash flow maths, or does it pay to wait for a cooler entry point?
Most Popular Narrative: 8% Undervalued
On the widely followed narrative, Marks and Spencer Group screens as modestly cheap, with a fair value of £4.45 against the latest £4.11 close, which puts free cash flow execution at the centre of the debate.
The expanded structural cost out programme, which has already delivered about £390m of repeatable savings and now targets £600m between FY 2022/23 and FY 2027/28, is intended to reduce operating expenses and leave more of each pound of sales dropping through to net margins and earnings.
What is behind 75 investors see Marks and Spencer Group as 8% undervalued.
Result: Fair Value of £4.45 (UNDERVALUED)
Still, the Marks and Spencer Group narrative can be knocked off course if International keeps shrinking on sales, or if heavy store and automation spending fails to lift returns.
Find out about the key risks to this Marks and Spencer Group narrative.
Another View: What The P/E Says About Marks and Spencer Group
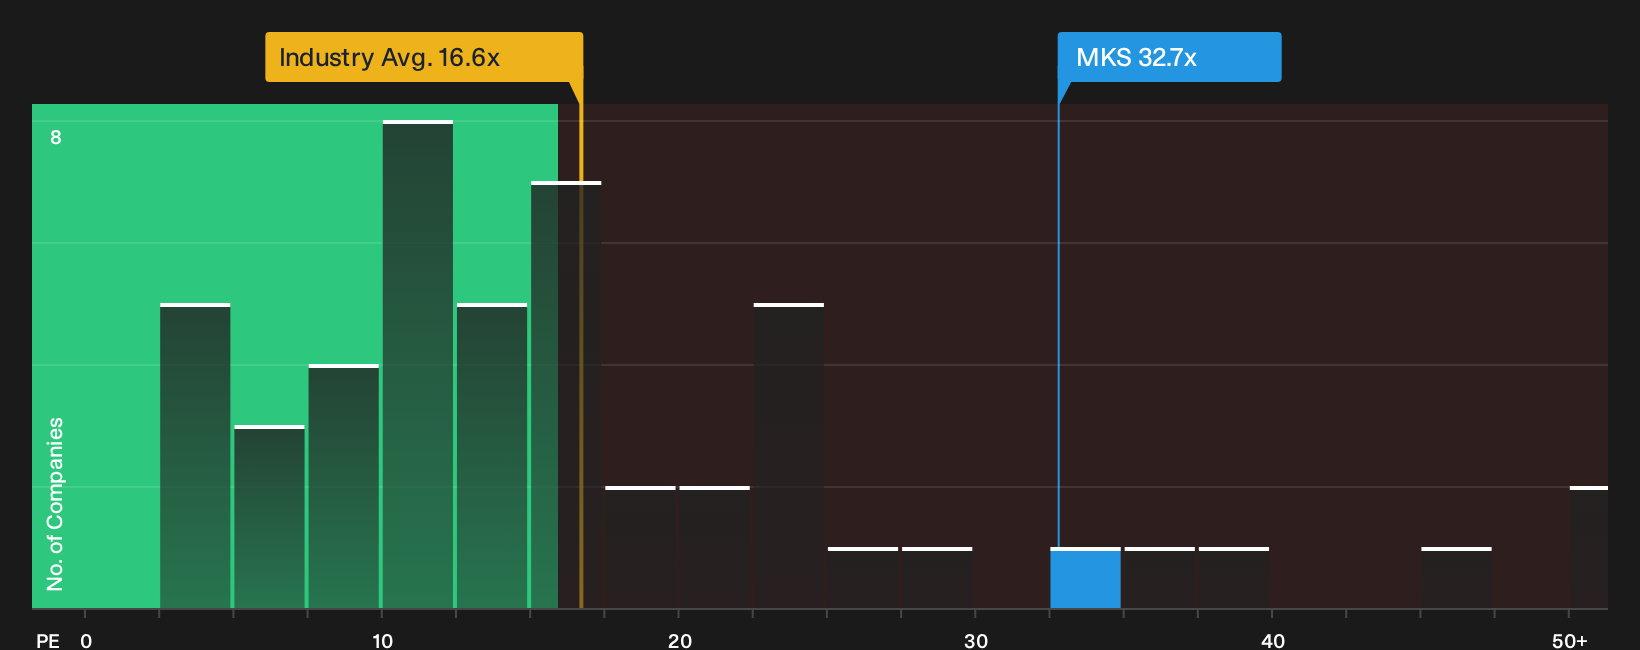
There is a very different message coming from the earnings multiple. Marks and Spencer Group trades on a P/E of 32.7x, which is almost double the European Consumer Retailing average of 16.4x and well above the 18.6x peer average. Yet the fair ratio is estimated at 36.7x, which sits even higher than today’s level and hints that sentiment could still swing either way if expectations shift.
For anyone weighing that gap between current P/E, sector norms and the fair ratio, it helps to see how the detailed valuation work stacks up against these headline numbers, and where the pressure points in the model really sit, in the See what the numbers say about this price — find out in our valuation breakdown..
Next Steps
Mixed messages on Marks and Spencer Group so far. If you want to move quickly and anchor your own view in the data, start with the 2 key rewards and 2 important warning signs.
Looking for more investment ideas beyond Marks and Spencer Group?
If Marks and Spencer Group has sharpened your focus on quality and price, do not stop here. Broaden your watchlist with targeted screeners that surface specific strengths.
- Target potential mispricings by scanning a curated set of companies that combine solid cash flows with supportive balance sheets through the 8 high quality undervalued stocks.
- Prioritise resilience by reviewing a list of solid balance sheet and fundamentals (9 results) that can help you focus on businesses with financial strength when conditions get tougher.
- Spot off-the-radar potential by working through 5 high quality undiscovered gems that pair quality fundamentals with lower market attention.
This article by Simply Wall St is general in nature. We provide commentary based on historical data and analyst forecasts only using an unbiased methodology and our articles are not intended to be financial advice. It does not constitute a recommendation to buy or sell any stock, and does not take account of your objectives, or your financial situation. We aim to bring you long-term focused analysis driven by fundamental data. Note that our analysis may not factor in the latest price-sensitive company announcements or qualitative material. Simply Wall St has no position in any stocks mentioned.
Have feedback on this article? Concerned about the content? Get in touch with us directly. Alternatively, email editorial-team@simplywallst.com