


Flotek Industries (FTK) Backlog Story Holds Focus, Is A 31% Undervaluation Still Credible?
Flotek Industries (FTK) has drawn fresh attention after a recent move in its share price, with the stock last closing at US$26.79 and posting mixed short term return figures.
Short term momentum around Flotek Industries has cooled, with the share price down 1.6% over one day and 9.7% over the past week. However, year to date the share price return of 57.1% and a one year total shareholder return of 68.4% still point to strong recent gains within a much larger multi year total shareholder return that is several times the initial investment.
Scan how Flotek Industries compares with other materials and energy plays that also showed strong recent moves by checking our hand picked list of 29 high quality undervalued stocks.
The share price surge in Flotek Industries is already significant, yet recent softness and a wide gap to analyst price targets suggest the real question now is how much upside the valuation still offers versus how much is already in the rear view mirror.
Most Popular Narrative: 31% Undervalued
Flotek Industries screens as undervalued in the most followed thesis, with a fair value of about $38.92 against the recent $26.79 close. This puts the spotlight firmly on how durable its contracted backlog and earnings mix really are.
Multi year contracts and a growing backlog for high margin Data Analytics and power services, which exceeded US$500 million by August 2026, provide revenue visibility and can support higher earnings quality as these long duration agreements convert into cash flow over time.
See why 15 investors see Flotek Industries as 31% undervalued.
Result: Fair Value of $38.92 (UNDERVALUED)
Still, the directed termination of the Puerto Rico power contract and any flare monitoring slowdown could chip away at the Flotek Industries backlog story that investors are watching.
Find out about the key risks to this Flotek Industries narrative.
Another View On Flotek Industries Valuation
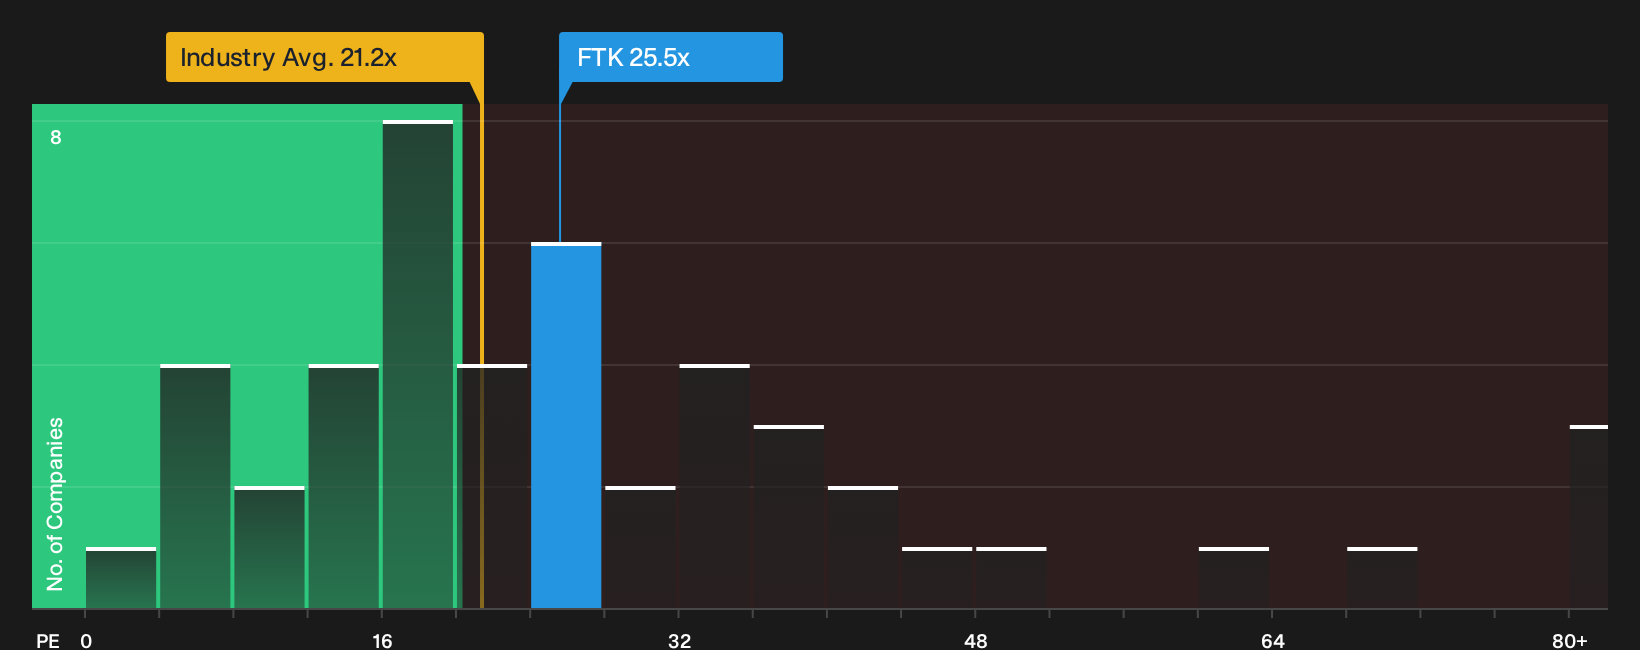
The fair value narrative for Flotek Industries leans heavily on analyst targets and earnings assumptions. A different lens is the current P/E of 25.5x, which sits below the 38.9x peer average for similar companies, yet above both the US Chemicals sector on 21.2x and a fair ratio of 15.8x. That mix of discount and premium points to a real question for investors: which reference point matters most for you?
Put simply, if the share price drifts toward the fair ratio, today’s earnings would support a lower multiple. In contrast, a move toward peers would argue the opposite. The gap between 25.5x, 38.9x and 15.8x marks out the valuation risk and opportunity range that holders of Flotek Industries need to weigh in practical terms, including how comfortable they are with paying up for growth and backlog quality relative to sector norms.
For a closer look at how the current pricing stacks up against these benchmarks, including where earnings quality and sector positioning fit in, See what the numbers say about this price — find out in our valuation breakdown..
Simply Wall St performs a discounted cash flow (DCF) on every stock in the world every day (check out Flotek Industries for example). We show the entire calculation in full. You can track the result in your watchlist or portfolio and be alerted when this changes, or use our stock screener to discover 29 high quality undervalued stocks. If you save a screener we even alert you when new companies match - so you never miss a potential opportunity.
Next Steps
Mixed signals around Flotek Industries valuation and momentum can be confusing, so move quickly, review the numbers, and weigh both sides of the story using 3 key rewards and 3 important warning signs.
Looking for more investment ideas beyond Flotek Industries?
If Flotek Industries has sharpened your focus on valuation and quality, do not stop here. Broaden your watchlist with targeted ideas other investors might miss.
- Target potential mispricings by scanning companies that combine quality fundamentals with marked valuation gaps using the 29 high quality undervalued stocks.
- Strengthen your income stream by reviewing businesses with robust payouts and yields through the 8 dividend fortresses.
- Prioritise resilience by checking our 31 resilient stocks with low risk scores that highlights stocks with more stable risk profiles and solid underlying metrics.
This article by Simply Wall St is general in nature. We provide commentary based on historical data and analyst forecasts only using an unbiased methodology and our articles are not intended to be financial advice. It does not constitute a recommendation to buy or sell any stock, and does not take account of your objectives, or your financial situation. We aim to bring you long-term focused analysis driven by fundamental data. Note that our analysis may not factor in the latest price-sensitive company announcements or qualitative material. Simply Wall St has no position in any stocks mentioned.
Have feedback on this article? Concerned about the content? Get in touch with us directly. Alternatively, email editorial-team@simplywallst.com