


AF Gruppen (OB:AFG) Just Gave Investors Something To Think About
AF Gruppen (OB:AFG) has secured a NOK 409 million design and build contract for Plot D at Campus Diakonhjemmet in Oslo, adding a sizable, sustainability focused project to its order book.
AF Gruppen shares trade at NOK 186.0 after a small 1 day share price gain of 0.32%. However, the stock has moved lower over the past week and past three months, which contrasts with a 1 year total shareholder return of 13.07% and a 3 year total shareholder return of 76.17%. This suggests that longer term holders have fared materially better than recent buyers as momentum has cooled.
Spot similar construction and infrastructure plays that combine contract momentum with robust fundamentals using our curated list of solid balance sheet and fundamentals (204 results).AF Gruppen continues to add contracts while the share price has cooled over recent months. Is most of the easy gain already behind the stock, or does the current valuation still leave meaningful upside on the table?
Preferred P/E of 17.3x: Is it justified for AF Gruppen?
On earnings, the AF Gruppen share price reflects a P/E of 17.3x, which sits above both local peers and the broader European construction group. That gap suggests investors are paying a premium for the current NOK 186.0 price compared to similar businesses on the same metric.
The P/E ratio compares the share price to earnings per share and gives a quick sense of how much investors are willing to pay for current profits. For a contractor like AF Gruppen, where project cycles and margins can swing over time, this metric helps you judge whether the market expects steadier profitability ahead or is being cautious.
AF Gruppen is described as expensive on a P/E basis versus its direct peer average of 14.5x and the wider European construction sector at 15.3x. That means the market is assigning a stronger valuation to each krone of earnings than it does for comparable operators, which can reflect confidence in earnings quality, return on equity or the contract pipeline. At the same time, the estimated fair P/E of 17.4x is very close to the current 17.3x, which points to the current pricing already sitting near the level the market could move towards based on that fair ratio work.
Explore the SWS fair ratio for AF Gruppen.
Result: Price-to-earnings of 17.3x (ABOUT RIGHT)
Still, the AF Gruppen story can be knocked off course if contract execution falters, or if pricing pressure squeezes profitability on its NOK 34,044.0m revenue base.
Find out about the key risks to this AF Gruppen narrative.
Another View on AF Gruppen: Cash Flows Paint a Different Picture
Earnings multiples indicate that AF Gruppen is fairly valued, while the SWS DCF model suggests a different perspective. Within that framework, NOK 186.0 is around 16.9% below an estimated future cash flow value of NOK 223.92. This positions the current quote as a potential discount rather than a premium.
Look into how the SWS DCF model arrives at its fair value.
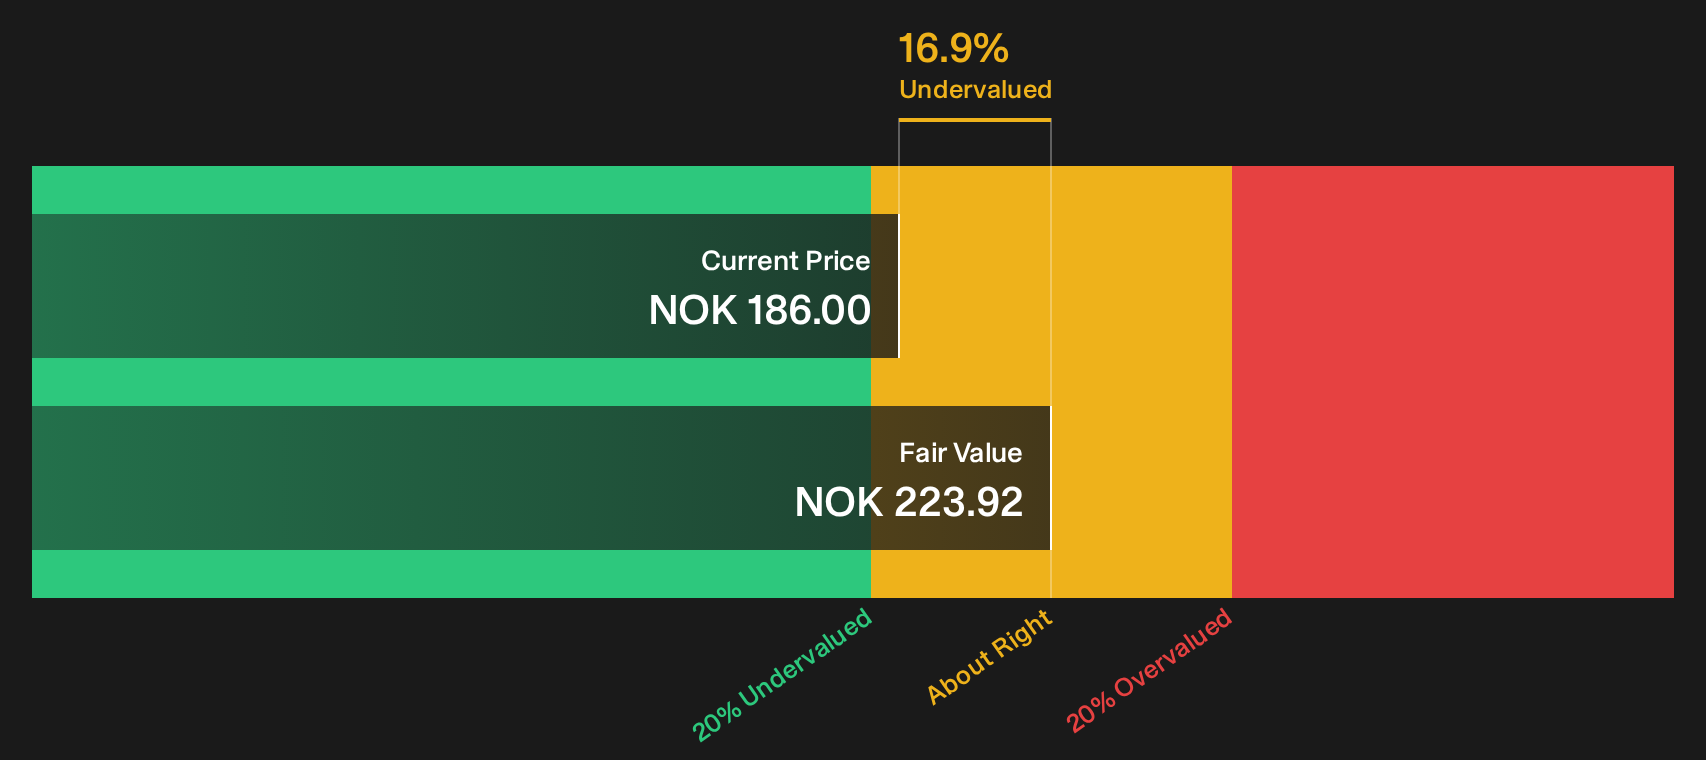
Simply Wall St performs a discounted cash flow (DCF) on every stock in the world every day (check out AF Gruppen for example). We show the entire calculation in full. You can track the result in your watchlist or portfolio and be alerted when this changes, or use our stock screener to discover 178 high quality undervalued stocks. If you save a screener we even alert you when new companies match - so you never miss a potential opportunity.
Next Steps
Mixed signals on AF Gruppen so far. If you want a clearer read on the balance between contract opportunity and execution risk, move quickly and weigh both sides of the data using our breakdown of 2 key rewards and 1 important warning sign
Looking for more AF Gruppen style investment ideas?
If AF Gruppen has sharpened your focus on quality and valuation, do not stop here. Put fresh ideas on your radar before the market prices them in.
- Target resilient balance sheets and steady fundamentals with a curated list of solid balance sheet and fundamentals (204 results) that filters out weaker profiles.
- Hunt for mispriced quality by scanning our hand picked 178 high quality undervalued stocks that may trade below their assessed worth.
- Build a portfolio with potential staying power by reviewing a focused 223 resilient stocks with low risk scores that screens for companies with lower risk scores.
This article by Simply Wall St is general in nature. We provide commentary based on historical data and analyst forecasts only using an unbiased methodology and our articles are not intended to be financial advice. It does not constitute a recommendation to buy or sell any stock, and does not take account of your objectives, or your financial situation. We aim to bring you long-term focused analysis driven by fundamental data. Note that our analysis may not factor in the latest price-sensitive company announcements or qualitative material. Simply Wall St has no position in any stocks mentioned.
Have feedback on this article? Concerned about the content? Get in touch with us directly. Alternatively, email editorial-team@simplywallst.com