


Kaneka (TSE:4118) Completes Buyback, Is The Stock Still Cheap?
Kaneka (TSE:4118) has just wrapped up a share repurchase program, buying 384,900 shares for ¥2,245.85 million. That finished tranche now gives investors fresh context for judging the recent share price performance.
The latest buyback follows a strong share price performance for Kaneka, with a year-to-date share price return of 35.24% and a 1-year total shareholder return of 48.10%. This points to momentum that has been building rather than fading.
Scan other momentum plays with fresh buybacks and rising returns by checking out our handpicked list of 12 high quality undervalued stocks alongside Kaneka.
Kaneka has just spent real money shrinking its share count while the stock has already run hard. Is this the moment to commit, or is patience for a cheaper entry the better bet as you weigh valuation next?
Preferred P/E of 10.1x for Kaneka: Is it justified?
On simple earnings terms, Kaneka trades on a P/E of 10.1x, which is below both the wider JP market and its Chemicals peers, even after the recent share price surge to ¥6,002.
The P/E ratio tells you how much investors are paying today for each unit of current earnings. For a diversified materials and healthcare group like Kaneka, this metric often becomes a quick shorthand for how the market views the durability of profits across PVC, advanced materials, healthcare products, and nutrition solutions.
Kaneka carries mixed signals. Earnings grew 58.2% over the past year and have risen 2.6% per year over five years, and profit margins improved from 2.8% to 4.3%. At the same time, forecasts point to earnings declining by an average of 2.5% per year over the next three years, and Return on Equity sits at 7.1%, which is flagged as low with expectations that it will remain low at 6.2% in three years. The current 3.5% dividend is not well covered by free cash flow either, which may be one reason the market is not assigning a richer multiple.
Against the JP market P/E of 13.9x, the JP Chemicals industry average of 13x, and an estimated fair P/E of 12x, Kaneka trades at a marked discount. That gap suggests investors are pricing in the forecast profit decline and low forecast ROE quite heavily, while the fair ratio hints the multiple could instead move closer to 12x if earnings quality normalises once the large one off gain of ¥12.0b rolls out of the numbers.
Explore the SWS fair ratio for Kaneka.
Result: Price-to-Earnings of 10.1x (UNDERVALUED)
Still, Kaneka’s annual net income decline and an analyst price target below the current ¥6,002 level could both temper enthusiasm if sentiment cools.
Find out about the key risks to this Kaneka narrative.
Another View: Kaneka Through a Cash Flow Lens
The earlier P/E work paints Kaneka as undervalued, yet the SWS DCF model points in the opposite direction. On this measure, the shares at ¥6,002 trade above an estimated future cash flow value of ¥5,764.06, which frames the stock as overvalued instead. Which yardstick do you trust more when real money is on the line?
Look into how the SWS DCF model arrives at its fair value.
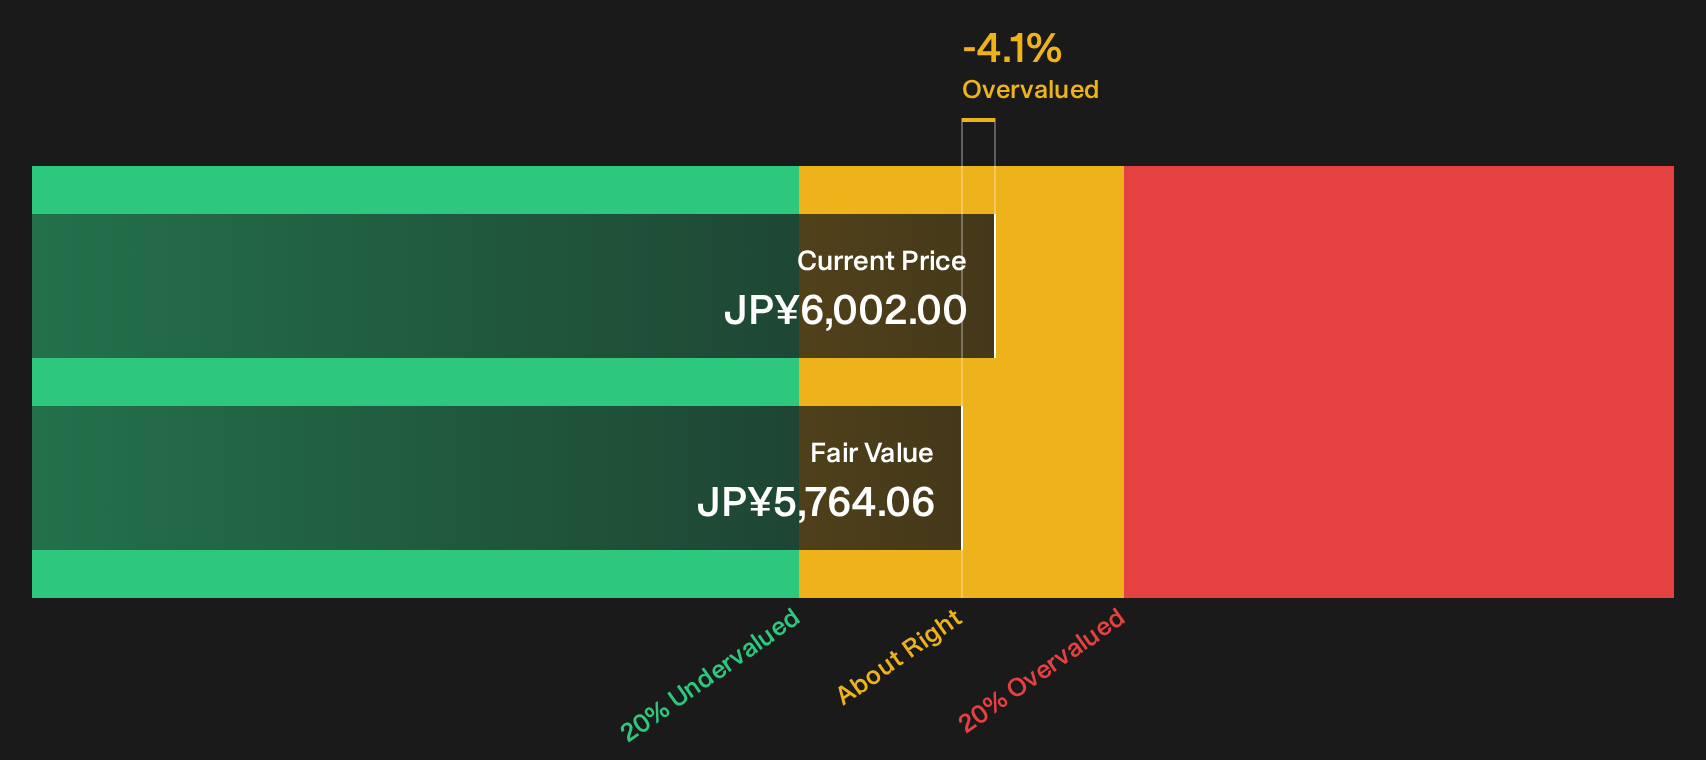
Simply Wall St performs a discounted cash flow (DCF) on every stock in the world every day (check out Kaneka for example). We show the entire calculation in full. You can track the result in your watchlist or portfolio and be alerted when this changes, or use our stock screener to discover 12 high quality undervalued stocks. If you save a screener we even alert you when new companies match - so you never miss a potential opportunity.
Next Steps
Plenty of signals around Kaneka point in different directions, so consider that tension as a prompt to act quickly, review the numbers yourself, and weigh both the downside alerts and upside potential highlighted in our 3 key rewards and 3 important warning signs
Looking for more investment ideas beyond Kaneka?
If Kaneka has your attention, do not stop here. Broaden your watchlist now and give yourself more options before the next move arrives.
- Target stronger income potential by focusing on companies that combine payout and resilience through our hand picked 28 dividend fortresses.
- Hunt for quality at a discount by scanning financially sound opportunities that still trade below their implied value using the 74 high quality undiscovered gems.
- Prioritise capital protection by filtering for sturdier businesses with healthier finances through our dedicated list of solid balance sheet and fundamentals (23 results).
This article by Simply Wall St is general in nature. We provide commentary based on historical data and analyst forecasts only using an unbiased methodology and our articles are not intended to be financial advice. It does not constitute a recommendation to buy or sell any stock, and does not take account of your objectives, or your financial situation. We aim to bring you long-term focused analysis driven by fundamental data. Note that our analysis may not factor in the latest price-sensitive company announcements or qualitative material. Simply Wall St has no position in any stocks mentioned.
Have feedback on this article? Concerned about the content? Get in touch with us directly. Alternatively, email editorial-team@simplywallst.com