


NSD (TSE:9759) Climbed, So What Is Behind The Fresh Attention?
NSD (TSE:9759) just tightened its shareholder story. Management raised earnings guidance for the current year, lifted dividend expectations, and recently completed a near 1% share buyback program announced in May 2026.
Recent price action suggests investors are warming to this new guidance from NSD. The 30 day share price return of 10.03% and 90 day gain of 14.23% came after the upgraded earnings outlook, even though the year to date share price return is still down 10.64% and the 1 year total shareholder return has slipped 5.74%. In contrast, the 5 year total shareholder return of 75.03% points to a much stronger longer term record.
Scan beyond NSD and see which other cash generative tech firms are quietly tightening shareholder returns in our 74 high quality undiscovered gems.
The guidance upgrade, richer dividend and completed buyback have already nudged NSD higher. After this rebound from a weaker year to date, does the current valuation still skew the risk reward toward buyers?
Price-to-Earnings of 17.2x: Is NSD’s valuation justified?
On Simply Wall St’s numbers, NSD trades on a P/E of 17.2x, which screens as good value against its estimated fair P/E of 18.4x and peer average of 23.6x, even though it sits slightly above the broader Japan IT group at 16.4x.
The P/E ratio compares the current share price to earnings per share and effectively shows how much investors are paying for each unit of profit. For an IT solutions provider like NSD, this yardstick links closely to the market’s expectations for future earnings quality and consistency.
Earnings have grown 12.2% over the past year, net profit margins have edged up from 10.8% to 11.1%, and the dividend yield sits at 3.19%. In that context, a 17.2x P/E that is below the implied “fair” level of 18.4x suggests the market is pricing the business at a discount to where the regression-based model indicates it could trade, while still applying a premium to the Japan IT industry and a discount to higher rated peers.
Explore the SWS fair ratio for NSD.
Result: Price-to-earnings of 17.2x (UNDERVALUED).
Still, concentration in Japan and reliance on financial and industrial IT clients leaves NSD exposed if sector spending or project pipelines soften.
Find out about the key risks to this NSD narrative.
Another view on NSD’s value
The P/E discussion presents NSD as modestly cheap. A second lens, the SWS DCF model, goes further and values the shares at ¥3,676.86 versus a market price of ¥3,039. That 17.3% gap suggests a larger cushion, but it also raises a question: is the cash flow path that optimistic?
Look into how the SWS DCF model arrives at its fair value.
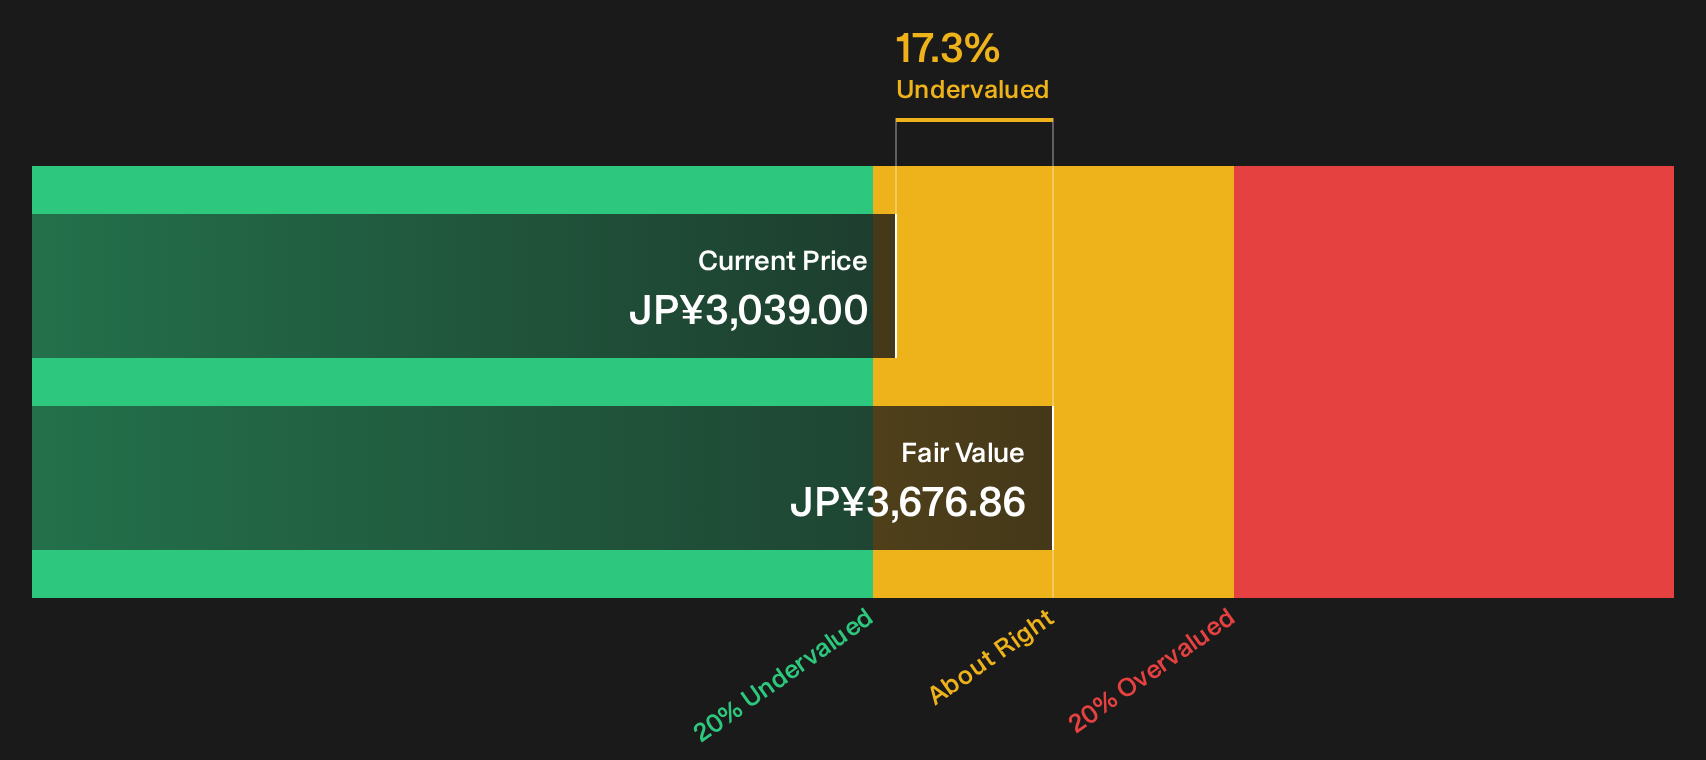
Simply Wall St performs a discounted cash flow (DCF) on every stock in the world every day (check out NSD for example). We show the entire calculation in full. You can track the result in your watchlist or portfolio and be alerted when this changes, or use our stock screener to discover 12 high quality undervalued stocks. If you save a screener we even alert you when new companies match - so you never miss a potential opportunity.
Next Steps
If this mix of guidance upgrades and valuation signals around NSD has you curious, move fast and check the data directly so you can decide how it stacks up for your portfolio. To see what investors are optimistic about, take a closer look at the 4 key rewards
Looking for more investment ideas beyond NSD?
If you want NSD to be just one of several well researched positions, cast the net wider with a few targeted stock ideas.
- Target dependable balance sheets and steady fundamentals with our curated list of solid balance sheet and fundamentals (23 results) so you are not relying on just one resilient story.
- Hunt for mispriced opportunities using the 12 high quality undervalued stocks and see which companies the numbers suggest are not fully reflected in current prices.
- Build a stream of potential portfolio income by reviewing the 28 dividend fortresses and spot payouts that could complement NSD’s yield profile.
This article by Simply Wall St is general in nature. We provide commentary based on historical data and analyst forecasts only using an unbiased methodology and our articles are not intended to be financial advice. It does not constitute a recommendation to buy or sell any stock, and does not take account of your objectives, or your financial situation. We aim to bring you long-term focused analysis driven by fundamental data. Note that our analysis may not factor in the latest price-sensitive company announcements or qualitative material. Simply Wall St has no position in any stocks mentioned.
Have feedback on this article? Concerned about the content? Get in touch with us directly. Alternatively, email editorial-team@simplywallst.com