


Exelon (EXC) Stock Still Looks Cheap Following Its 40% Five Year Run
Exelon has delivered a 40.5% gain over the past five years, even though shorter term returns have been softer. That puts fresh focus on what you are really paying for its earnings at around US$41.76 a share. With the utilities group often treated as an income and stability play, the immediate question is whether that price still lines up with the profit power of the underlying business.
- The 40.5% rise over 5 years shows that long term holders have already captured a meaningful compounding return, so any new decision now leans heavily on what current earnings justify.
- For a regulated utility like Exelon, the value story usually hinges on how efficiently it can turn its asset base into steady profit and cash flow, since those earnings streams often underpin both reinvestment and shareholder payouts.
- The analysts covering Exelon have run their own numbers. See what analysts think Exelon's shares could be worth.
The issue now is whether Exelon's recent share price around US$41.76 is adequately supported by the earnings it generates today and what investors expect those profits to look like over time.
If you want a wider view on where Exelon sits in the income and stability space, a focused stock screen of power grid and infrastructure plays is a useful next step via 43 power grid technology and infrastructure stocks.
Does Exelon Look Undervalued on Earnings?
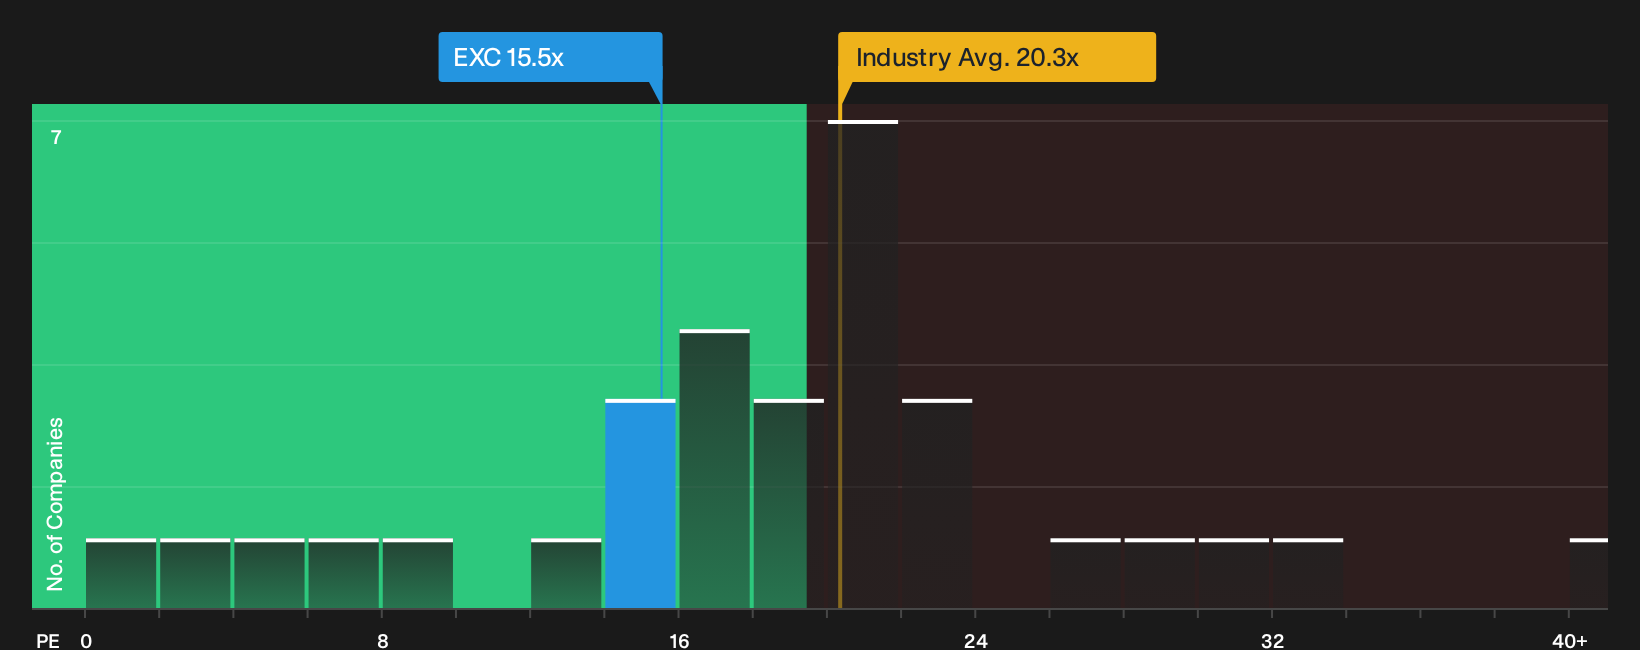
The P/E ratio tends to matter most for Exelon because investors usually anchor regulated utility valuations to steady earnings rather than aggressive growth stories. On that score, Exelon trades at about 15.5x earnings, which sits below the Electric Utilities sector average of roughly 20.3x and under the broader peer group at about 19.7x.
The fair P/E level implied by the valuation work, which blends Exelon's growth outlook, profitability profile, size and risk, points to a higher multiple than the market is currently paying. That gap suggests the stock changes hands at a discount to what those fundamentals might justify, even after the share price move of recent years. For an investor weighing Exelon against other income oriented grid operators, the current P/E leaves room to argue that the market is not fully pricing in the earnings power already on display. Explore the numbers behind Exelon's P/E valuation.
The Exelon Narrative: What Would Justify Today's Price?
Simply Wall St Narratives pick up where Exelon's valuation puzzle leaves off. They spell out which assumptions on future growth, profitability and earnings would need to hold for the stock to be worth materially more or less than today. Each narrative treats Exelon's implied fair value as a specific, testable idea about how the business might develop over time, so you can track how that view holds up as new information comes through.
One of the top community narratives on Exelon: 14% undervalued
The rebalanced US$41.7b capital plan that shifts US$1.5b into higher earning transmission while deferring US$1.1b of lower priority distribution projects…
Discover why this Narrative puts Exelon at 14% undervalued.
One more piece of the Exelon puzzle before you decide
Before acting on Exelon's current valuation, it helps to see where professional forecasters think earnings and cash flows could sit a few years from now compared with what the market is pricing in today. Explore where analysts expect Exelon to be in a few years.
This article by Simply Wall St is general in nature. We provide commentary based on historical data and analyst forecasts only using an unbiased methodology and our articles are not intended to be financial advice. It does not constitute a recommendation to buy or sell any stock, and does not take account of your objectives, or your financial situation. We aim to bring you long-term focused analysis driven by fundamental data. Note that our analysis may not factor in the latest price-sensitive company announcements or qualitative material. Simply Wall St has no position in any stocks mentioned.
Have feedback on this article? Concerned about the content? Get in touch with us directly. Alternatively, email editorial-team@simplywallst.com