


Kusuri No Aoki Holdings (TSE:3549) Just Gave Investors Something To Consider
Kusuri No Aoki Holdings (TSE:3549) released preliminary sales figures for September 2026, reporting all store sales at 112.8% and existing store sales at 102.4%. Investors are weighing what this means for the stock.
At a share price of ¥4,138, Kusuri No Aoki Holdings has seen the 90 day share price return of 12.42% contrast with a year to date decline of 8.65%. Meanwhile, the 1 year total shareholder return of 12.60% and 5 year total shareholder return of 71.55% point to momentum that has built over longer periods as investors react to a mix of monthly sales updates and broader sentiment shifts around the business.
Compare Kusuri No Aoki Holdings' latest sales-driven momentum with a curated set of resilient retailers by scanning the list of solid balance sheet and fundamentals (23 results) that could handle tougher conditions.
After a sharp 90 day rebound but a weaker year to date path, the real question for Kusuri No Aoki Holdings is whether that sales momentum still offers enough upside to justify today’s price.
Price-to-Earnings of 20.7x: Is it justified for Kusuri No Aoki Holdings?
Kusuri No Aoki Holdings trades on a P/E of 20.7x, which lines up with a share price of ¥4,138 that screens as mixed value depending on which yardstick you use.
The P/E ratio compares what investors pay today for each unit of current earnings. For a retailer like Kusuri No Aoki Holdings, this gauge often reflects how durable investors think its profit growth and cash generation will be over time.
On one side, the stock is described as good value against a peer average P/E of 46.7x, which suggests the market is not pricing Kusuri No Aoki Holdings as aggressively as some comparable retailers. On the other side, the same 20.7x multiple is seen as expensive against the broader JP Consumer Retailing industry average of 12.6x, and it also sits well above an estimated fair P/E level of 14.5x that the market could gravitate toward if sentiment cools.
Explore the SWS fair ratio for Kusuri No Aoki Holdings.
Result: Price-to-Earnings of 20.7x (OVERVALUED)
Still, the narrative around Kusuri No Aoki Holdings could be challenged if sales soften or if the current P/E multiple moves closer to sector levels.
Find out about the key risks to this Kusuri No Aoki Holdings narrative.
Another View: Kusuri No Aoki Holdings Through A Cash Flow Lens
The earlier P/E check hinted that Kusuri No Aoki Holdings screens as expensive against its industry, even if it looks cheaper than peers. Our DCF model tells a different story. At ¥4,138, the stock trades about 9.2% below an estimated cash flow based value of roughly ¥4,555, which implies the market is giving limited credit to those projected cash streams.
That kind of gap can look like a margin of safety to some or a sign that investors still question how reliable those future cash flows will be. The real issue for you is simple: Which signal carries more weight, the earnings multiple or the cash flow math?
Look into how the SWS DCF model arrives at its fair value.
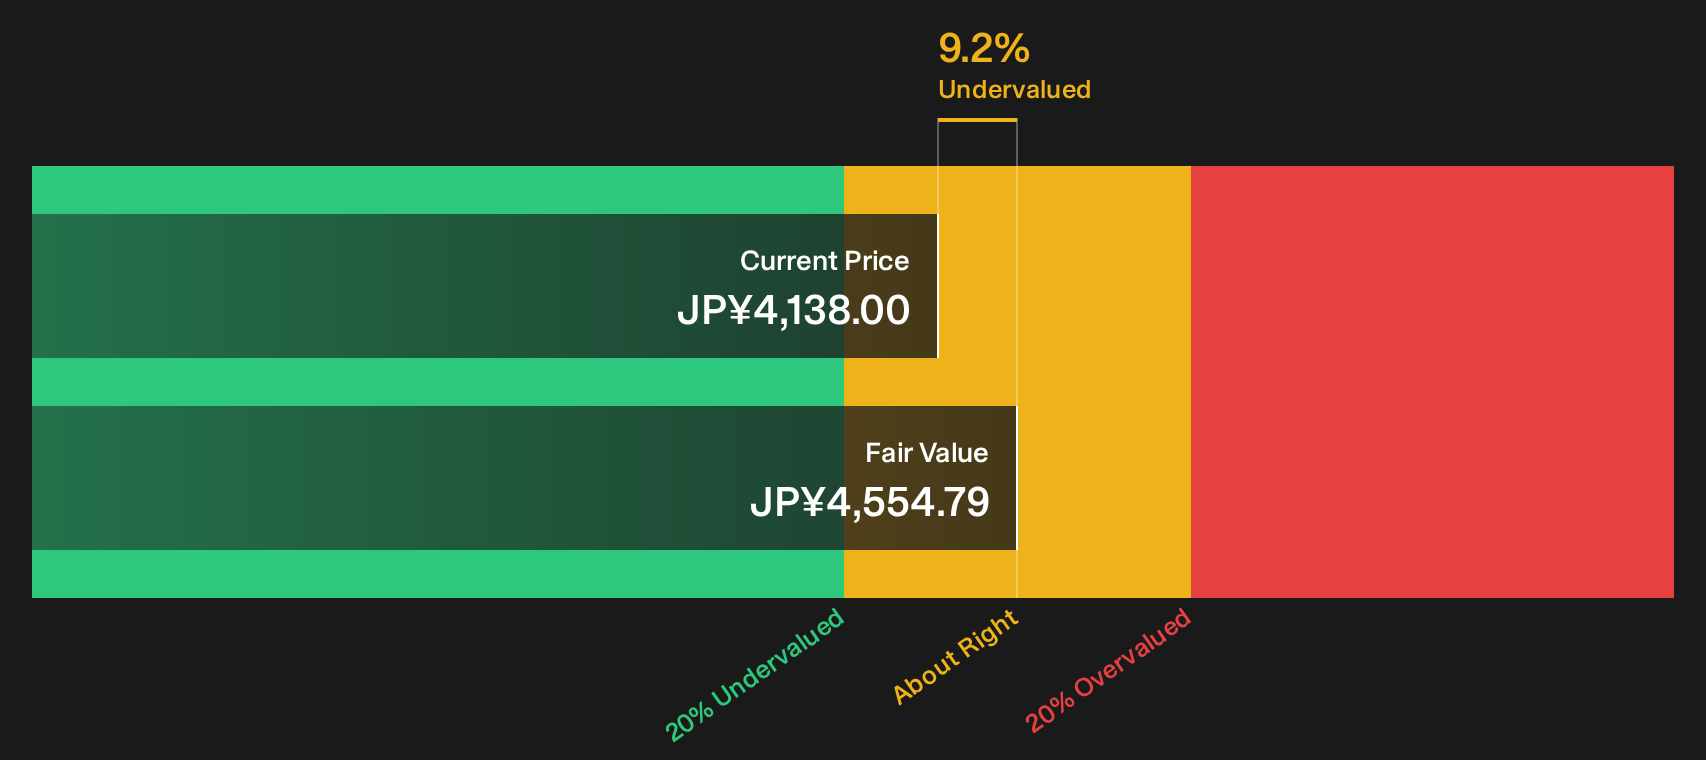
Simply Wall St performs a discounted cash flow (DCF) on every stock in the world every day (check out Kusuri No Aoki Holdings for example). We show the entire calculation in full. You can track the result in your watchlist or portfolio and be alerted when this changes, or use our stock screener to discover 12 high quality undervalued stocks. If you save a screener we even alert you when new companies match - so you never miss a potential opportunity.
Next Steps
Mixed signals or emerging opportunity? Either way, if Kusuri No Aoki Holdings is on your radar, it may make sense to act promptly, review both the concerns and the positives, and base your own view on the underlying data by weighing the 3 key rewards and 2 important warning signs.
Looking for more ideas beyond Kusuri No Aoki Holdings?
If Kusuri No Aoki Holdings has sharpened your focus on valuation and quality, do not stop here. Broaden your watchlist while this research is fresh in your mind.
- Target dependable compounders by scanning a 12 high quality undervalued stocks that blend strong fundamentals with prices that may leave room for further upside.
- Prioritise resilience by reviewing a 23 resilient stocks with low risk scores built around sturdier balance sheets and steadier risk profiles.
- Hunt for under-followed opportunities by filtering through 74 high quality undiscovered gems that pair quality metrics with lower market attention.
This article by Simply Wall St is general in nature. We provide commentary based on historical data and analyst forecasts only using an unbiased methodology and our articles are not intended to be financial advice. It does not constitute a recommendation to buy or sell any stock, and does not take account of your objectives, or your financial situation. We aim to bring you long-term focused analysis driven by fundamental data. Note that our analysis may not factor in the latest price-sensitive company announcements or qualitative material. Simply Wall St has no position in any stocks mentioned.
Have feedback on this article? Concerned about the content? Get in touch with us directly. Alternatively, email editorial-team@simplywallst.com