


Universal Display (OLED) Stock Looks Below Fair Value Today
Universal Display has seen its share price fall sharply over recent years, which puts fresh focus on whether the current valuation is still backed by the earnings power of the business. With investors already absorbing a long stretch of weak returns, the question now is how much of that earnings story is already reflected in today’s US$74.96 price.
- Over the past 5 years the stock has declined 55.0%, which raises the issue of whether the market has reset its expectations around Universal Display's profit engine too far or not far enough.
- The company’s model, built around licensing and material sales for OLED technology, can have a meaningful effect on margins and the timing of cash flows, which directly shapes how much investors may be willing to pay for each dollar of earnings.
- Your read on Universal Display is one view; the desks covering it have another. See what analysts think Universal Display's shares could be worth.
The issue now is whether Universal Display's current share price is justified by the earnings it generates today and what investors expect those profits to look like over time.
If you are weighing whether Universal Display’s earnings justify the current price, it can help to compare that question across 28 high quality undervalued stocks.
Does Universal Display Look Undervalued on Earnings?
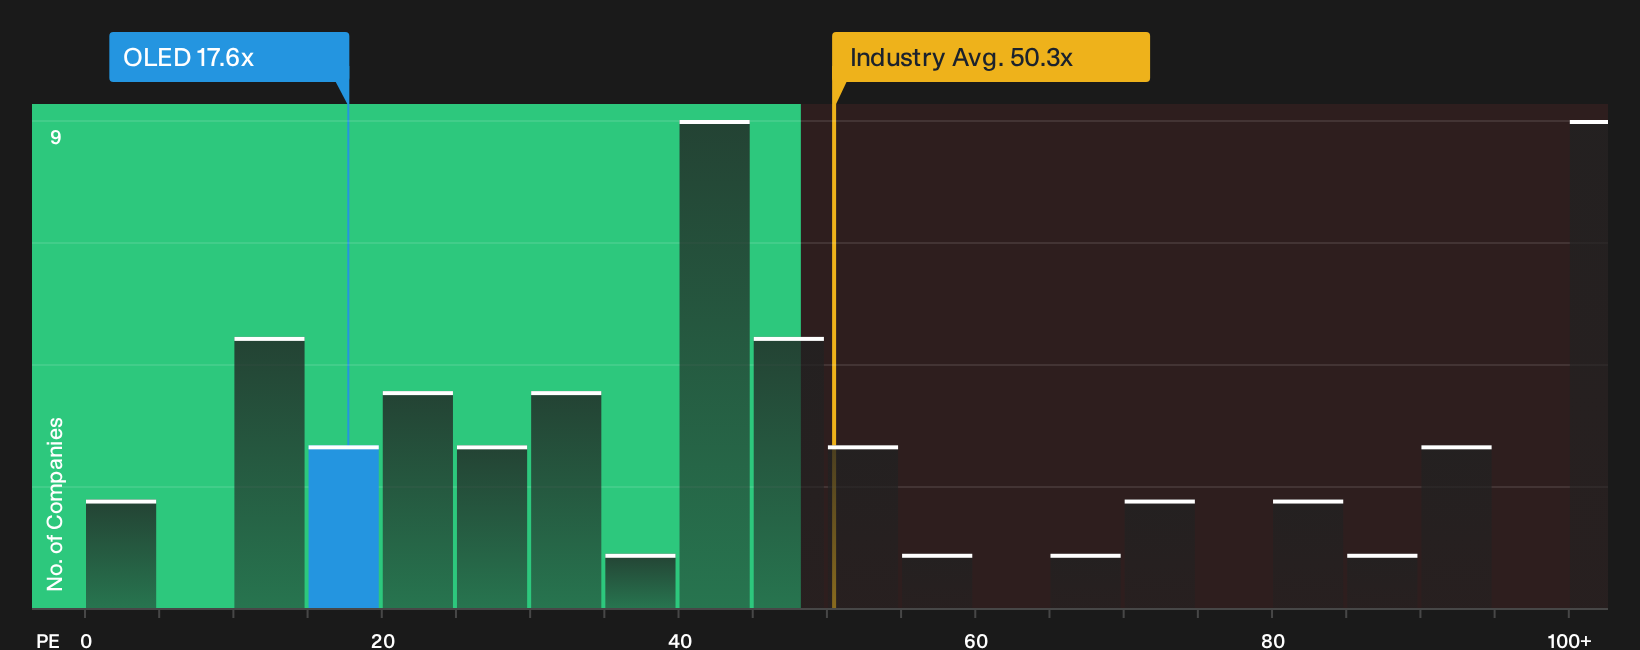
The P/E ratio suits Universal Display because earnings are the main driver that investors focus on for this kind of licensing heavy business. On this yardstick, the stock trades on a P/E of 17.6x, which is far below the broader semiconductor industry average of 50.3x and also below the 63.0x peer group figure. That is a wide gap for a specialist in OLED technology.
The fair multiple that blends Universal Display’s growth profile, profitability, size and industry risk points to a higher P/E than where the shares change hands today. That places the current 17.6x below this more tailored benchmark and signals that the market is pricing the earnings stream at a discount to what this framework would suggest. For anyone assessing Universal Display, the key question is whether the earnings quality and contract structure justify that gap or hint at mispricing. Explore the numbers behind Universal Display's P/E valuation.
The Universal Display Narrative: What Would Justify Today's Price?
Simply Wall St Narratives pick up where the Universal Display valuation puzzle leaves off by spelling out what kind of growth, profitability and earnings path would need to hold for the stock to be worth materially more or less than today’s price on the Community page. Rather than relying on a single multiple or model output, each Narrative lays out the earnings and margin assumptions behind its view of fair value so you can later compare those inputs with the actual results Universal Display reports over time.
Community views on Universal Display are split between one camp that sees meaningful upside and another that treats the recent reset as roughly in line with the risk.
Bull case: 35% undervalued
"Commercialization of phosphorescent blue emitters and related architectures is progressing, with tablet-size prototypes on commercial lines and reported energy efficiency gains of around 15%..."
Discover why this Narrative puts Universal Display at 35% undervalued.
Bear case: 6% overvalued
"Uneven ordering patterns like the recent pull-ins and timing shifts may continue to cause volatility in quarterly revenue and limit near term earnings visibility..."
Explore why this Narrative puts Universal Display at 6% overvalued.
Universal Display’s value still hinges on who is steering it
Valuation only tells part of the story for Universal Display, because the people setting priorities, signing contracts and deciding how they are rewarded can tilt long term outcomes in ways the numbers here do not answer. See who runs Universal Display and how they are paid.
This article by Simply Wall St is general in nature. We provide commentary based on historical data and analyst forecasts only using an unbiased methodology and our articles are not intended to be financial advice. It does not constitute a recommendation to buy or sell any stock, and does not take account of your objectives, or your financial situation. We aim to bring you long-term focused analysis driven by fundamental data. Note that our analysis may not factor in the latest price-sensitive company announcements or qualitative material. Simply Wall St has no position in any stocks mentioned.
Have feedback on this article? Concerned about the content? Get in touch with us directly. Alternatively, email editorial-team@simplywallst.com