


Why Everyone Is Watching Kirin Holdings Company (TSE:2503) Right Now
Kirin Holdings Company (TSE:2503) is in the spotlight after Japan’s antitrust watchdog raided major brewers over suspected beer price coordination, an investigation that could affect the group’s pricing approach and brand perception.
Recent trading reflects that tension. Kirin Holdings Company’s share price has a year to date return of 18.49% at ¥2,800, while the 1 year total shareholder return of 33.91% and 5 year total shareholder return of 59.89% indicate momentum that has been building over a longer horizon. At the same time, the antitrust raid and ongoing buyback activity are helping shape how investors reassess both risk and future prospects.
Scan how other consumer and beverage stocks are reacting to similar regulatory pressure by checking the hand picked 23 resilient stocks with low risk scores alongside Kirin Holdings Company.
The recent move in Kirin Holdings stock sits between two stories: business progress and shifting mood after the antitrust raid and buyback. How much of today’s price really reflects the underlying value?
Preferred P/E of 11.4x: Is it justified?
On simple earnings terms, Kirin Holdings Company trades on a P/E of 11.4x, while our estimates and peer data point to a richer level that markets sometimes pay for similar businesses.
P/E compares the current share price to earnings per share. For a consumer and beverage group like Kirin Holdings Company, it is often used as a quick gauge of how much investors are paying for each unit of profit, especially when earnings are established and not extremely volatile.
Here, the stock sits at a P/E of 11.4x against an estimated fair P/E of 20x and an Asian beverage industry average of 16.6x. This suggests investors are pricing Kirin at a clear discount that could reflect caution about growth, regulatory scrutiny, or balance sheet risk. Compared with a peer average P/E of 33.3x, the gap is even wider and indicates the market is assigning a much lower earnings multiple than the fair ratio that models suggest it could move toward.
Explore the SWS fair ratio for Kirin Holdings Company.
Result: Price-to-Earnings of 11.4x (UNDERVALUED)
Still, the antitrust probe and Kirin Holdings Company’s exposure to tightly regulated alcoholic beverages could unsettle sentiment if pricing power or brand perception weakens.
Find out about the key risks to this Kirin Holdings Company narrative.
Another View on Kirin Holdings: What the DCF Says
The earlier P/E discussion points to Kirin Holdings Company looking cheap against peers and the fair ratio. A different lens tells a similar story. Our DCF model estimates fair value at ¥5,352.55 per share versus today’s ¥2,800, which suggests the stock is trading significantly below this cash flow-based estimate.
That kind of gap can indicate potential mispricing, or it can reflect real concern about future earnings and regulation. Which side of that line do you think Kirin belongs on?
Look into how the SWS DCF model arrives at its fair value.
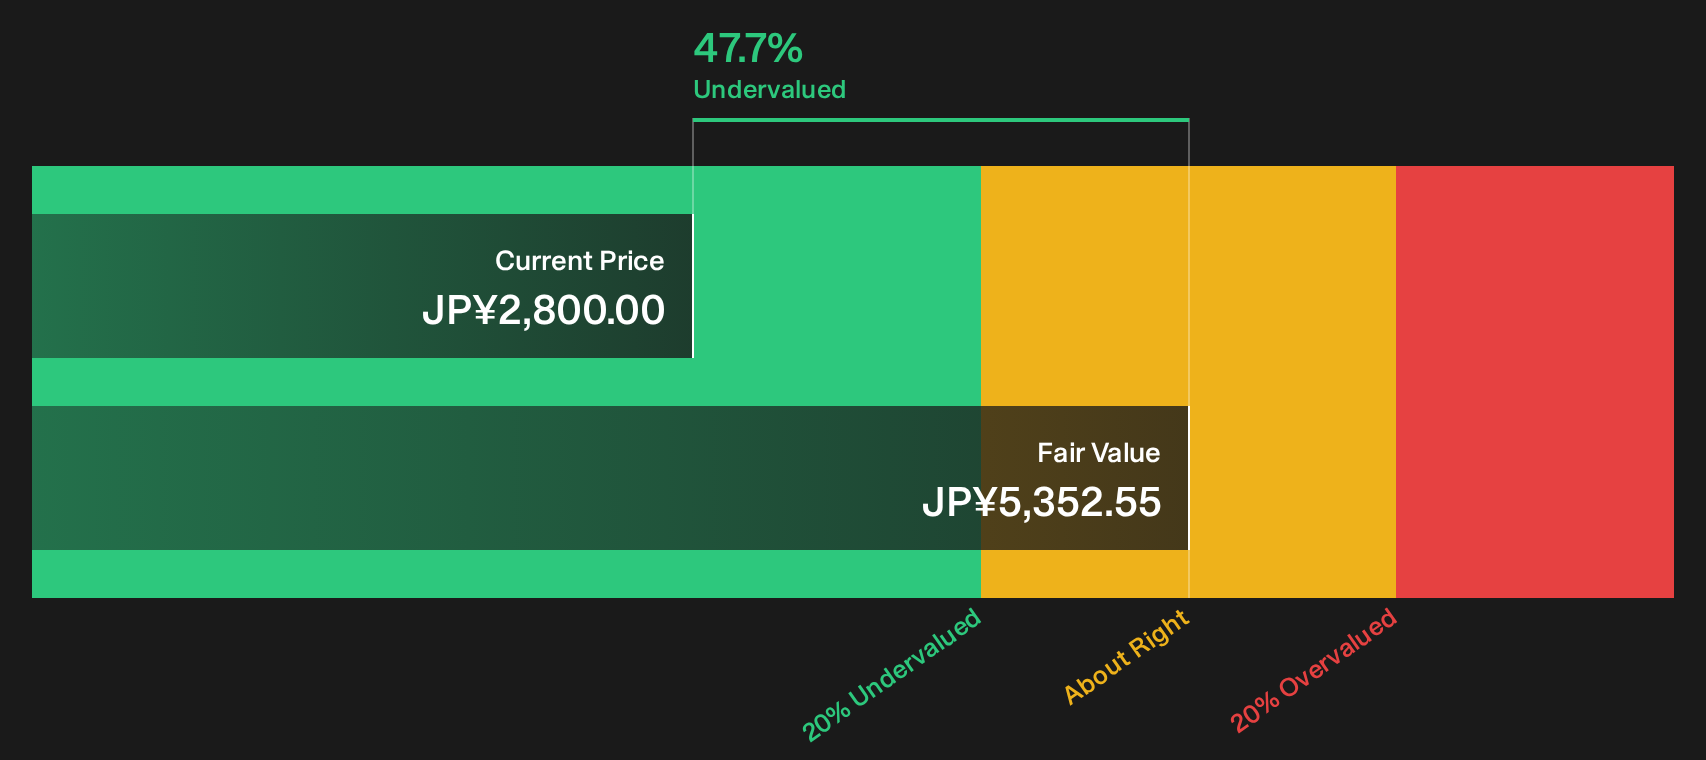
Simply Wall St performs a discounted cash flow (DCF) on every stock in the world every day (check out Kirin Holdings Company for example). We show the entire calculation in full. You can track the result in your watchlist or portfolio and be alerted when this changes, or use our stock screener to discover 12 high quality undervalued stocks. If you save a screener we even alert you when new companies match - so you never miss a potential opportunity.
Next Steps
Mixed signals around Kirin Holdings Company and the antitrust probe can feel messy. Pressure test the numbers, risk flags and upside drivers yourself through the 4 key rewards and 1 important warning sign.
Looking for more ideas beyond Kirin Holdings Company?
If you stop with Kirin Holdings Company, you miss a bigger opportunity set. Use the Simply Wall St screener to line up your next move with intent.
- Target resilient returns by scanning companies with stronger balance sheets and cleaner fundamentals through the list of solid balance sheet and fundamentals (23 results).
- Hunt for potential value gaps by sorting stocks that combine quality fundamentals with cheaper prices using the 12 high quality undervalued stocks.
- Build a cash flow focused watchlist by zeroing in on income ideas in the 28 dividend fortresses.
This article by Simply Wall St is general in nature. We provide commentary based on historical data and analyst forecasts only using an unbiased methodology and our articles are not intended to be financial advice. It does not constitute a recommendation to buy or sell any stock, and does not take account of your objectives, or your financial situation. We aim to bring you long-term focused analysis driven by fundamental data. Note that our analysis may not factor in the latest price-sensitive company announcements or qualitative material. Simply Wall St has no position in any stocks mentioned.
Have feedback on this article? Concerned about the content? Get in touch with us directly. Alternatively, email editorial-team@simplywallst.com