


Focusing on Bonds’ Past Performance Is the Biggest Mistake You Could Make in 2026
The standard regulatory disclaimer – “past performance is no guarantee of future results” – has been in every mutual fund prospectus and ETF factsheet for so long, it is almost a meme. Yet, when DIY investors log into their brokerage accounts or screen for investments, what is the very first metric 90% of them look at?
The 1-year, 3-year, and 5-year trailing total return columns.
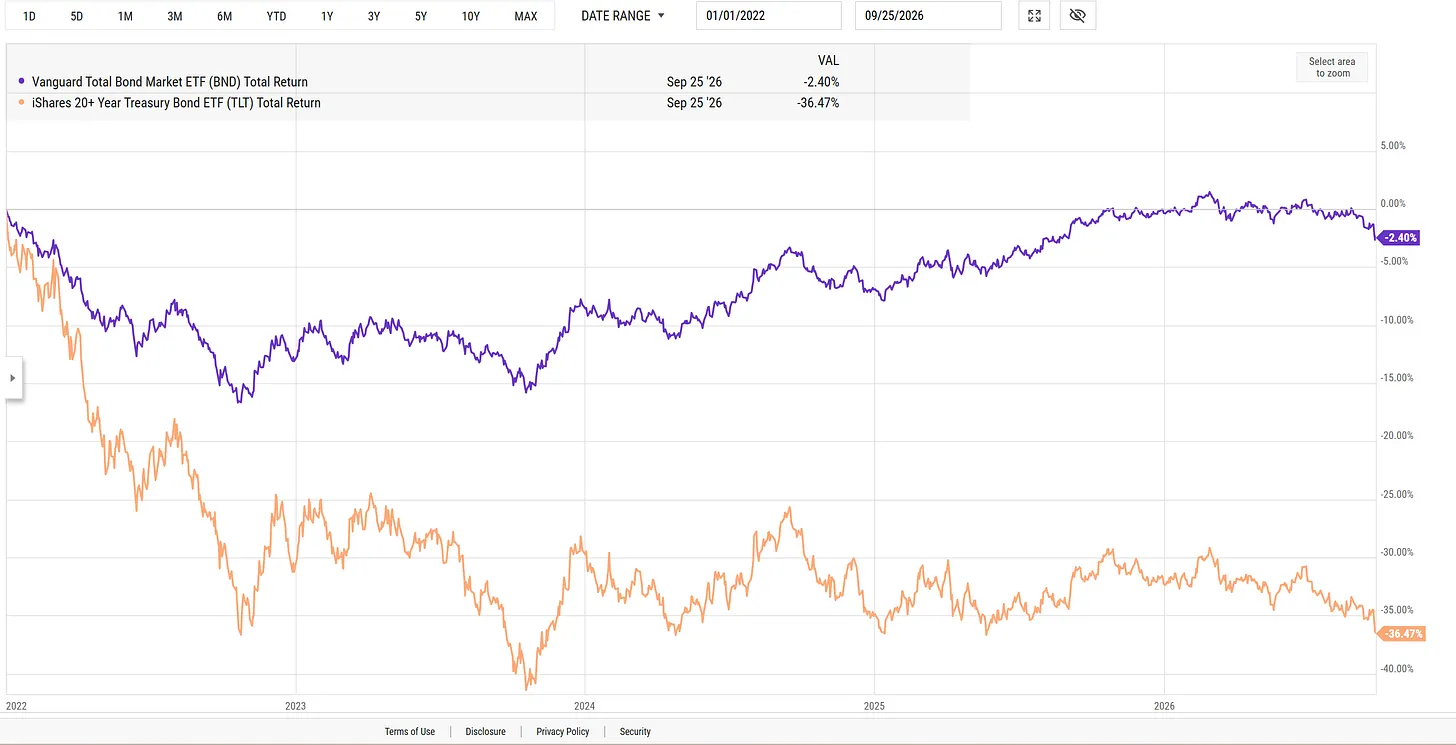
Or, a flat-to-down chart like this. That’s the Vanguard Total Bond Market ETF (BND) and the iShares 20+ Year Treasury Bond ETF (TLT), a pair of popular bond ETFs.
In equity investing, chasing past performance is a classic mistake that lures investors into buying valuation peaks.
But in fixed income, judging an asset by its historical performance in 2026 will undoubtedly be an “unforced error” for investors and traders. If you are evaluating bond ETFs based on how they performed over the last three to five years, you are missing the very thing that makes them attractive. To understand why trailing bond returns are completely useless today, you have to look at how we got here:
The ZIRP Era (2020-2021): During the zero-interest-rate-policy era, benchmark Treasuries yielded between 0.5% and 1.5%. Investors received virtually zero cash coupon income while taking on maximum price sensitivity. That’s a lot of what we call “duration risk.”
The Rate Shock (2022-2024): As central banks raised rates to combat inflation, bond yields surged. Because bond prices move inversely to yields, existing low-coupon bond funds suffered their worst multi-year drawdowns in modern market history. It is the type of thing even relative old-timers like me can only say we read about. I grew up in the 1970s, but a bond was more a word to describe a friendship with one of my Fair Lawn High School classmates, not the high, inflation-driven rates on U.S. Treasury securities.
Because trailing return calculations look backward across that rate-hiking blizzard, major broad-market bond proxies, like the iShares Core US Aggregate Bond ETF (AGG) or Vanguard Total Bond Market ETF (BND) show dismal 3-year and 5-year annualized returns that sit near zero or in negative territory.
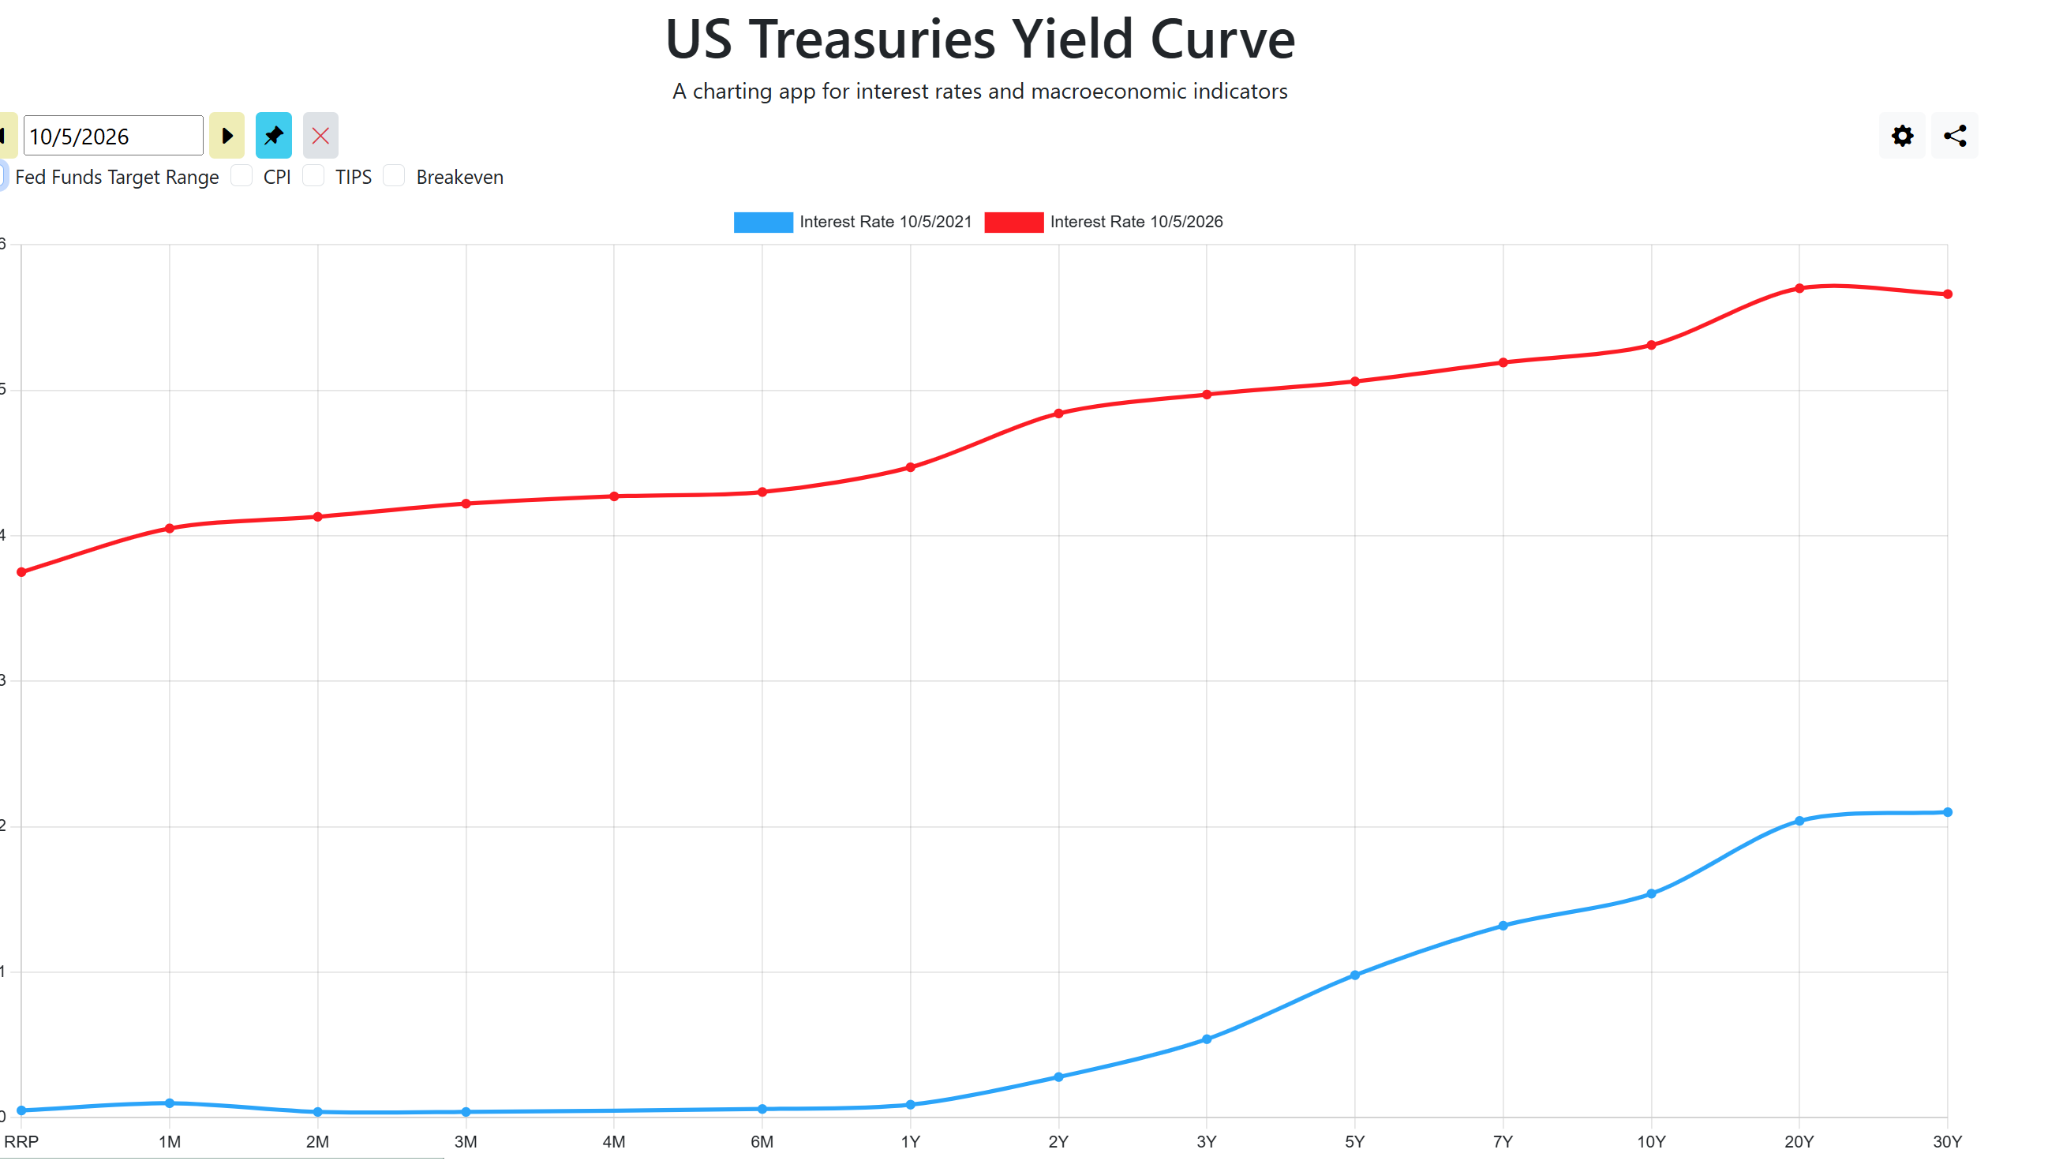
These two lines represent the yield curve five years ago (blue) and now (red). They are in different area codes! These do not even seem to be the same thing. But they are just half a decade apart. THAT is why this is such a unique time for investors. And why investors should avoid the typical traps like “it did so poorly, why would I invest in it?”
And you know what that means? The same thing it does when a stock or sector you like is in the dumps. It is getting more and more attractive!
Stock declines might be a case of a broken company. But with bonds, it is more about math. The math of credit costs and interest rates. Because bonds are contracts between investors and issuers. Looking at a bond fund’s negative 3-year return tells you what happened when yields moved from 1% to 5%. It tells you absolutely nothing about what happens next when starting yields sit at multi-decade highs.
When you buy a bond or a defined-maturity bond ETF, and plan to hold it to maturity, you know right then and there what your worst-case return will be.
That’s barring default. And if that’s even a reasonable possibility, it is out of my range to consider anyway.
So if a 5-year bond yields 5% as it does now, that’s the lowest return you can get, unless both of these things happen:
- Rates go up
- You sell the bond before it matures
But Wait, There’s More
Because while rates going up means your bond return may not keep up with inflation for a while, if rates ultimately end up in a similar range, in this case five years hence, it was just noise. No different than buying a stock, seeing it fall, not selling it, and then cashing it out at a nice annualized profit over the next five years.
Yet for some reason, when bonds go down, it is typically viewed more harshly. Even though a bond, unlike a stock, has a set return from here to maturity. Not eternity, maturity. And we know what that is at all times.
The other reason that bonds can actually be a friend to investors, more now than ever in our adult lifetimes, is that if rates go down from here, and before the bond matures, that 5% return we talked about above is what we said it was: a worst-case scenario.
Here’s the iShares 7-10 Year Treasury Bond ETF (IEF), which is one of the oldest bond ETFs around, dating back to 2002. That allows me to show you just how much its price rallied, from 2007 to 2013, and again from 2019 to 2020. Rates fell from peak levels, and IEF not only delivered its income return, it added a lot more due to the appreciation of the bond prices.
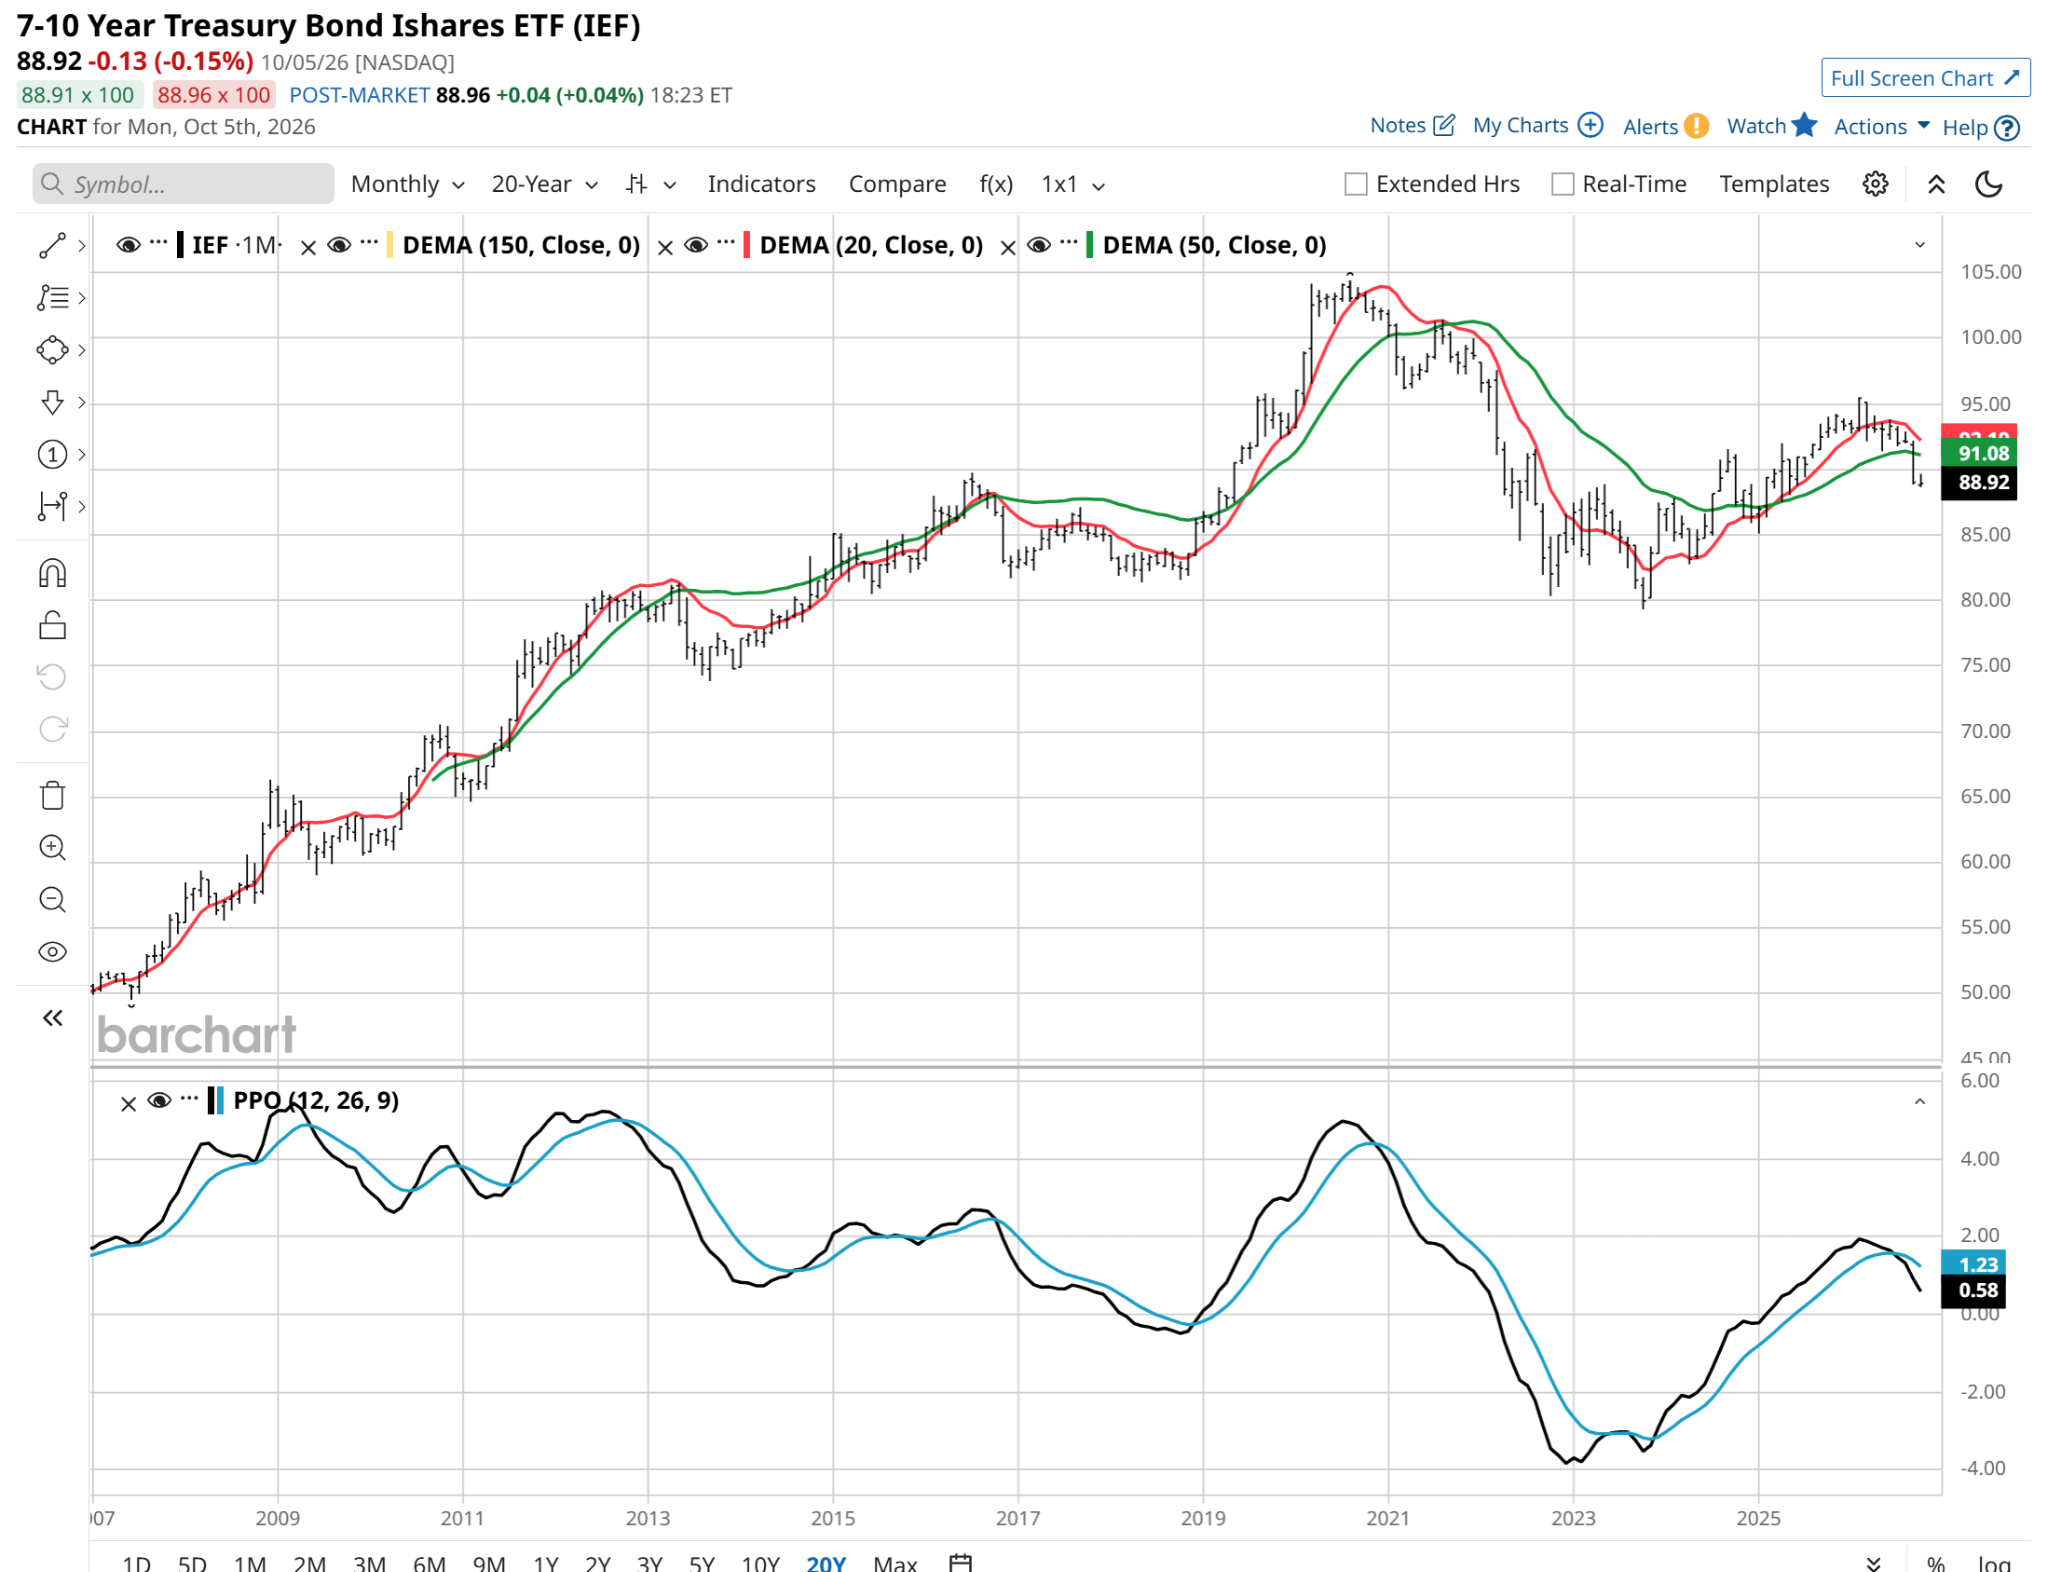
Specifically, from roughly $50 to $80 during that first six-year period. And from around $80 to $105 in a two-year span later on. That’s a 60% return and a 30% return, respectively. Strong high single-digit to double-digit returns. From bonds. Simply because rates dropped.
No earnings to track, not market multiples, no AI bubbles. Just rates and bonds. That’s something to think about in a world that used to believe there was no alternative to stocks. There sure is now, if you refuse to be sidetracked by irrelevant data points like bonds’ past performance.
Rob Isbitts is a semi-retired CIO, former fiduciary investment advisor, and Barchart columnist. Check out his other work at ETFYourself.com (featuring the Fresh Charts weekly trading post), and ROAR.PiTrade.com, helping investors to better-manage their own portfolios.
On the date of publication, Rob Isbitts did not have (either directly or indirectly) positions in any of the securities mentioned in this article. All information and data in this article is solely for informational purposes. For more information please view the Barchart Disclosure Policy here.