


3 U.S. Life Insurance Stocks Built For Higher Treasury Yields
Bond markets are roaring back into the spotlight as the 10-year U.S. Treasury yield pushes above 5% and the U.S. debt pile climbs beyond US$40 trillion. That shift is reshaping which stocks benefit when investors park money for the long haul. If you care about how higher long-term yields might quietly rewire returns, this article walks through three life insurance and annuity providers that are exposed to that story.
The three insurers that follow are only a sample of what this higher-yield backdrop can mean for U.S. life and annuity providers, and the full screen surfaced 14 more companies with equally compelling narratives that are not covered here. To see the broader field and identify which tickers best fit your own risk and income goals, analyze the U.S. Life Insurers and Annuity Providers Benefiting from Higher Long-Term Yields screener.
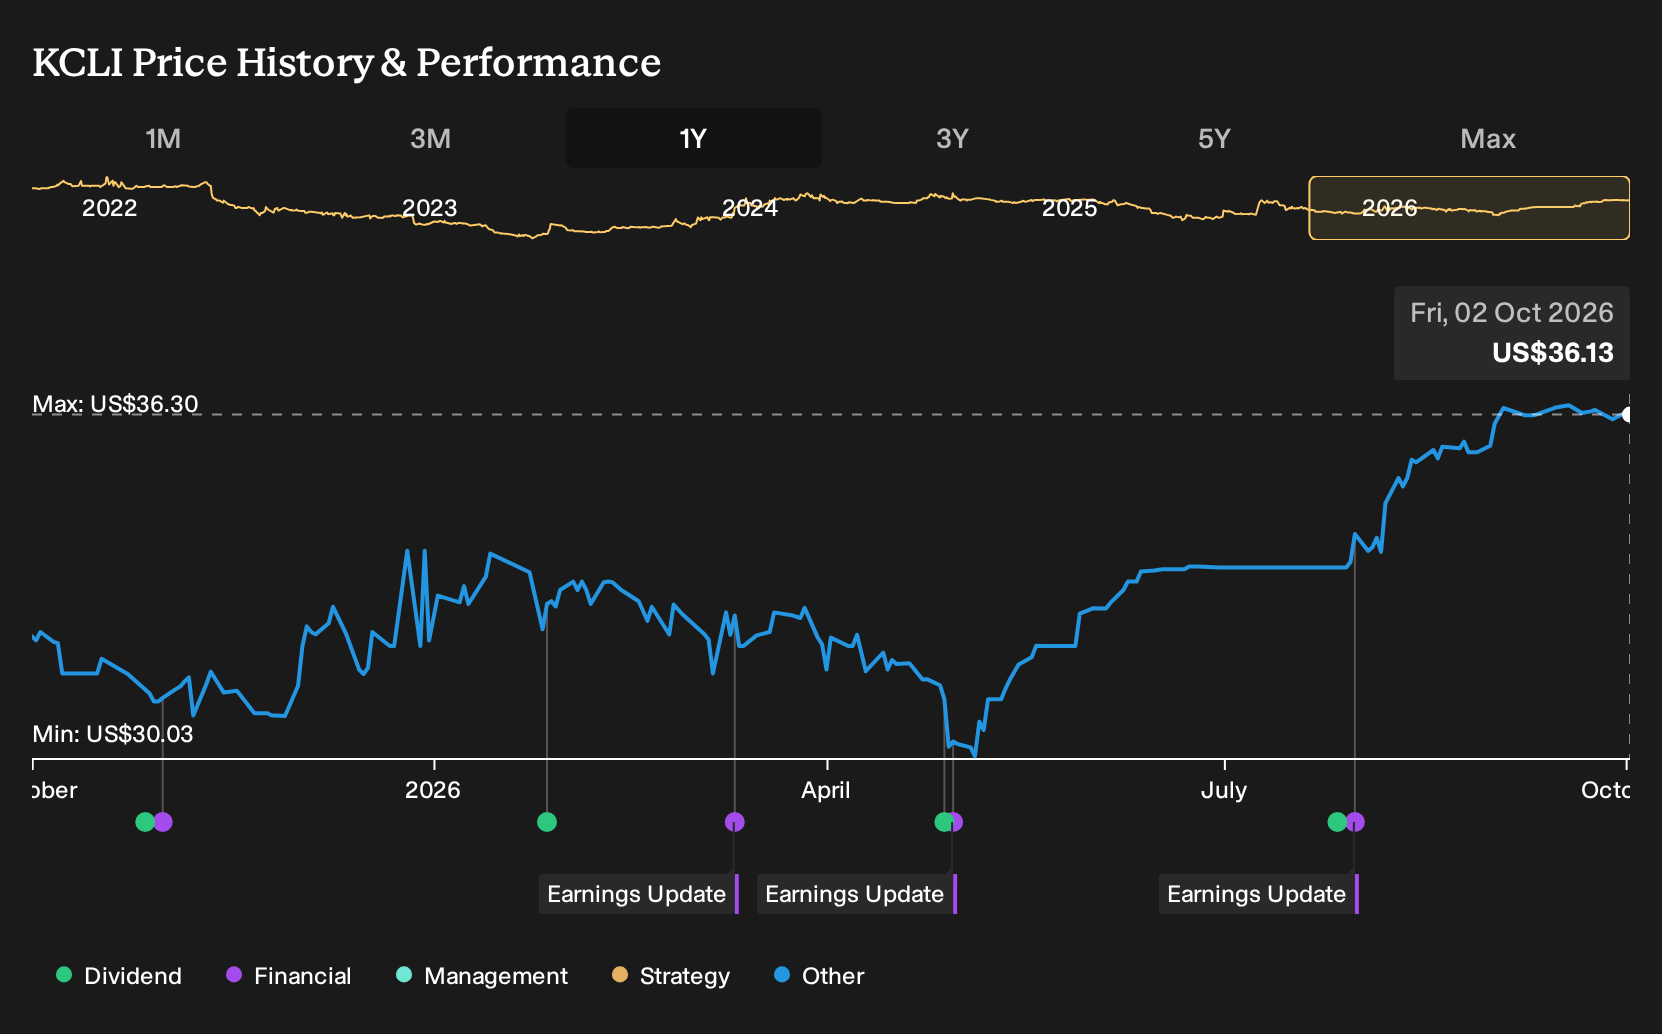
Kansas City Life Insurance (KCLI)
Overview: Kansas City Life Insurance provides long-duration individual and group life policies and final expense products, tying policyholder premiums to long-term bond portfolios in a higher yield setting.
Operations: Kansas City Life Insurance generates about US$326 million from Individual Insurance, US$92 million from Old American, and US$71 million from Group Insurance, with all US$489 million earned in the United States.
Market Cap: US$350 million
Kansas City Life Insurance operates in the long-duration life segment. Higher 10 year Treasury yields can support investment income as policies run off over decades. Recent 2026 results show a move back into profit and visible dividends, which puts more weight on what happens when one unseen pressure on its cash flows shifts.
That shift in pressure is exactly what makes the 2 key rewards and 3 important warning signs (2 are major!) so useful for weighing how Kansas City Life Insurance’s yield tailwind compares with its hidden weak spots.
Genworth Financial (GNW)
Overview: Genworth Financial sells mortgage insurance, long-term care coverage, and retirement-focused life and annuity products tied to long-dated bond portfolios.
Operations: Genworth Financial generates about US$1.3b from Enact, US$6.1b from Closed Block, and US$35 million from Corporate and Other.
Market Cap: US$3.6b
Genworth Financial sits squarely in the long-duration camp, with mortgage insurance cash flows and long-term care liabilities both sensitive to higher 10 year yields and discount rates. Investors looking at the life and annuity trade get a business that benefits when new money can be invested around 6% to 7% on long bonds, depending on how one unseen pressure plays out on those future claim costs.
That unseen pressure is exactly what the 2 warning signs (1 is major!) helps spotlight, before those long-term care and mortgage exposures start pulling in a different direction.

UTG (UTGN)
Overview: UTG, Inc. is a U.S. life insurer focused on long-duration individual policies, reinsurance services, and related real estate investments.
Operations: UTG generates about US$67 million from life insurance, with all reported revenue earned in the United States.
Market Cap: US$182 million
UTG is exposed to the higher long-term yield environment, with a U.S. life book of long-dated liabilities and a bond-centric approach that can benefit when new cash is invested at higher coupons. The stock trades on a 5.1x P/E with a 52.6% net margin, and its profitability may improve if one current pressure on its funding costs eases.
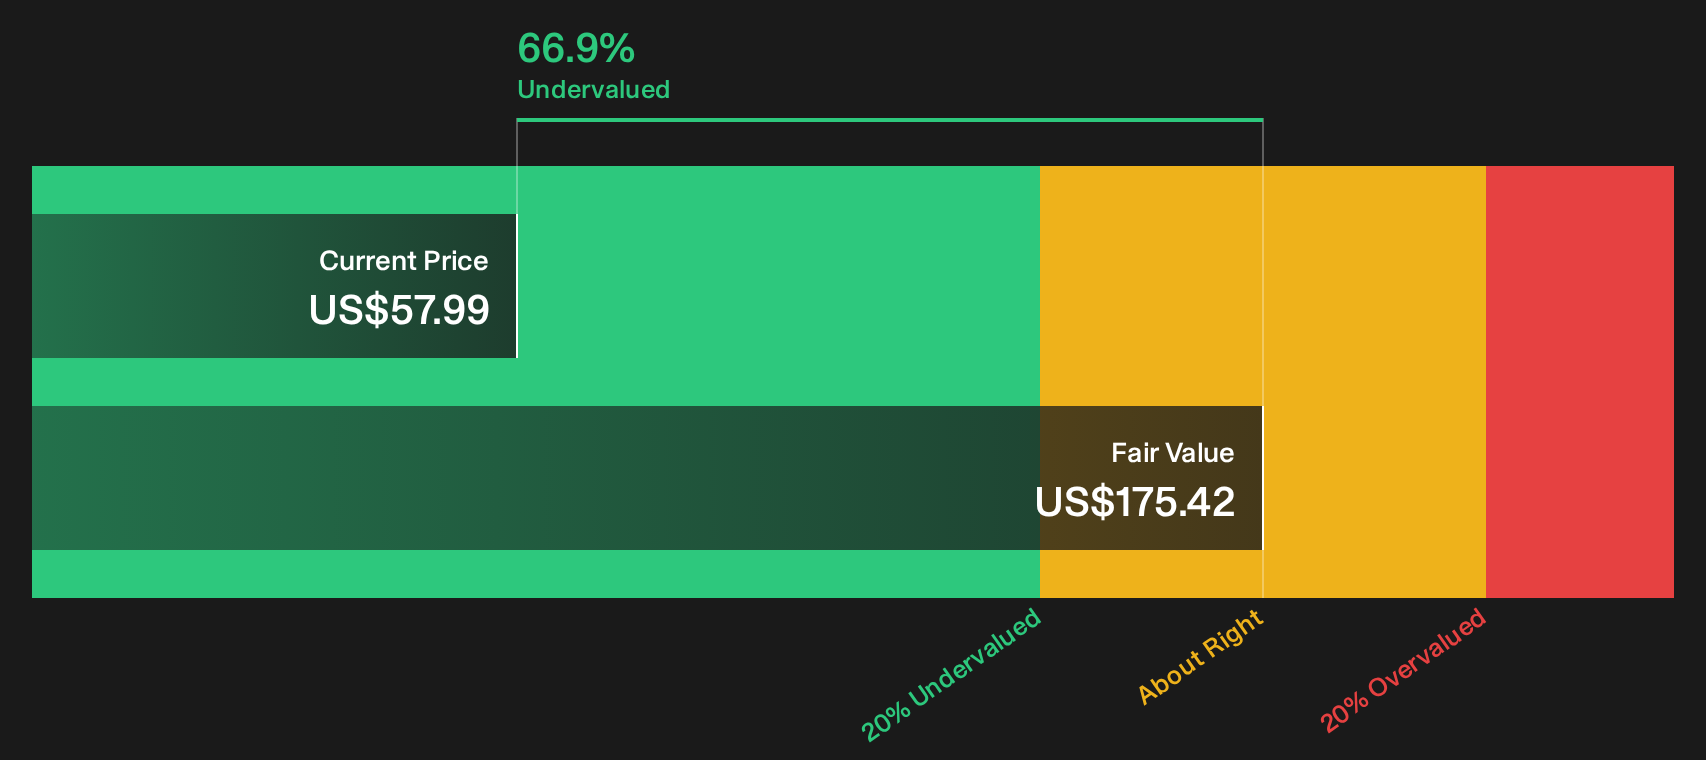
If that pressure on funding costs is the real swing factor for UTG, the DCF valuation analysis for UTG shows where that could start to bite or surprise.
Seeking Alternatives Before The Crowd?
Fresh stock ideas move fast. By the time momentum is flying, the best entry points can be gone. Scan these curated shortlists while it still matters and get in early.
- Target high-yield income plays built to carry their payouts by focusing on the 7 dividend fortresses before yields are identified and repriced by the wider market.
- Track where real business momentum meets AI interest by reviewing the 37 profitable AI stocks that aren't just burning cash while these operators stay under the radar for now.
- Consider positioning ahead of potential materials moves by checking the 16 top copper producer stocks while these producers remain quietly priced and capacity is still being absorbed.
This article by Simply Wall St is general in nature. We provide commentary based on historical data and analyst forecasts only using an unbiased methodology and our articles are not intended to be financial advice. It does not constitute a recommendation to buy or sell any stock, and does not take account of your objectives, or your financial situation. We aim to bring you long-term focused analysis driven by fundamental data. Note that our analysis may not factor in the latest price-sensitive company announcements or qualitative material. Simply Wall St has no position in any stocks mentioned.
Have feedback on this article? Concerned about the content? Get in touch with us directly. Alternatively, email editorial-team@simplywallst.com