


RLI (RLI) Is Back In The Spotlight, What Is Catching Investors’ Attention?
RLI Corp (RLI) has drawn investor attention after its shares closed at US$55.94 on 30 September 2026, with returns over the past month and the past 3 months both showing declines.
For RLI, the short-term picture has cooled. The 30 day share price return is down 10.35% and the 90 day share price return is down 9.45%, while the 5 year total shareholder return of 35.87% shows a much stronger longer run outcome.
Scan how RLI compares with other insurers under pressure by reviewing our curated list of 31 resilient stocks with low risk scores that have held up better through recent share price swings.
RLI has slid over the past quarter, yet still trades only modestly below one published price target and a small intrinsic value estimate. Is most of the opportunity already used up, or is there meaningful upside left?
Most Popular Narrative: 7.5% Undervalued
RLI is trading at $55.94 against a widely followed fair value anchor of $60.50, which frames the recent pullback as a relatively small discount rather than a deep value setup.
Elevated frequency and severity of natural catastrophe events, combined with RLI’s decision to buy a smaller catastrophe tower that reduces its ceded premium ratio by about 5 points for 2026, is expected to leave more catastrophe risk on its balance sheet. This could increase earnings volatility and strain net margins in future severe event years.
See why 3 investors see RLI as 8% undervalued.
Result: Fair Value of $60.50 (UNDERVALUED)
Still, if higher catastrophe retention coincides with softer property pricing or if expense ratios stay elevated, the bullish RLI valuation story could quickly lose support.
Find out about the key risks to this RLI narrative.
Another View On RLI’s Valuation
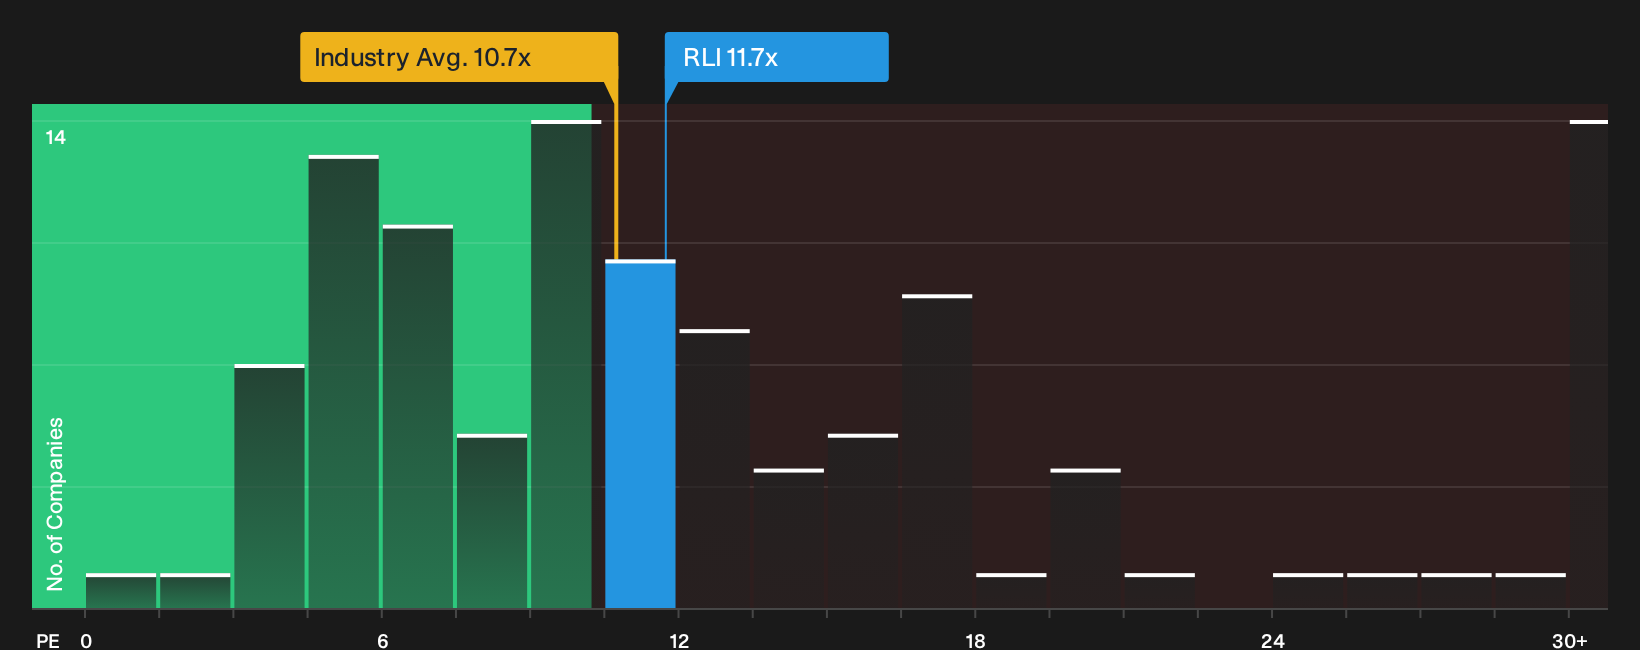
RLI might look 7.5% undervalued on a fair value anchor of $60.50, yet the P/E picture is less generous. The shares trade on 11.7x earnings compared with 10.7x for the US Insurance industry, 7.3x for peers, and a fair ratio of 7.5x. Is that premium really comfortable if forecasts soften further?
To stress test that gap against the earnings profile and risk factors, take a closer look at the valuation breakdown in the See what the numbers say about this price — find out in our valuation breakdown.
Next Steps
Mixed signals around RLI’s valuation can create either hesitation or opportunity, so review the underlying data now and decide where you stand on its 2 key rewards and 2 important warning signs.
Ready for more ideas beyond RLI?
If RLI has you rethinking where to put fresh capital, use this moment to scan other opportunities that fit clear, no-nonsense criteria across the market.
- Target potential mispricings by reviewing a focused set of quality candidates through the 31 high quality undervalued stocks.
- Strengthen your income stream by assessing companies with consistent cash returns inside the 7 dividend fortresses.
- Prioritise resilience by filtering for financially robust businesses using the list of solid balance sheet and fundamentals (25 results).
This article by Simply Wall St is general in nature. We provide commentary based on historical data and analyst forecasts only using an unbiased methodology and our articles are not intended to be financial advice. It does not constitute a recommendation to buy or sell any stock, and does not take account of your objectives, or your financial situation. We aim to bring you long-term focused analysis driven by fundamental data. Note that our analysis may not factor in the latest price-sensitive company announcements or qualitative material. Simply Wall St has no position in any stocks mentioned.
Have feedback on this article? Concerned about the content? Get in touch with us directly. Alternatively, email editorial-team@simplywallst.com