


Is OEM International (OM:OEM B) Fully Valued Following Its Chair Exit Plan?
Board shift puts OEM International in focus
OEM International (OM:OEM B) has moved into the spotlight after Chair of the Board Christopher Norbye told directors he plans to step down, with an Extraordinary General Meeting targeted for mid October 2026.
OEM International shares trade at SEK181.4 and recent momentum has been firm, with a 30-day share price return of 5.22% and a year-to-date share price gain of 31.64%. The 3-year total shareholder return of 169.94% points to strong longer term compounding despite the latest boardroom change.
See how OEM International compares with other industrial suppliers gaining renewed interest by exploring our hand picked list of list of solid balance sheet and fundamentals (206 results)
After a strong run in OEM International shares and with a planned board shake-up on the horizon, does the current valuation still leave enough potential to justify fresh risk for buyers stepping in now?
Price-to-earnings of 37.7x for OEM International: Is it justified?
OEM International now trades on a P/E of 37.7x, which sits against a last close of SEK181.4 and frames the recent share price strength as anything but cheap when lined up against its peers.
The P/E ratio compares what investors are paying today with the company’s current earnings, so a higher figure usually reflects expectations for solid profit expansion or a perceived quality premium. For a technology trading group supplying industrial automation components across Europe, that kind of multiple suggests the market is already baking in a meaningful growth story rather than treating OEM International as a low-growth distributor.
Against the wider European Trade Distributors industry on 16.8x earnings, the stock carries more than double the sector multiple. This signals investors are willing to pay a steep premium for each unit of current profit. The gap is also wide versus the estimated fair P/E of 21.5x. That level is highlighted by our fair ratio work as a point the valuation could move toward if sentiment cools or earnings do not keep pace with expectations.
Explore the SWS fair ratio for OEM International.
Result: Price-to-earnings of 37.7x (OVERVALUED).
Still, OEM International faces clear pressure points if earnings growth slows or the European industrial cycle softens, which could challenge such a rich P/E multiple.
Find out about the key risks to this OEM International narrative.
Another view on OEM International's value
The rich P/E on OEM International tells one story. The SWS DCF model tells another. On that cash flow view, the shares at SEK181.4 sit about 3.6% below an estimated value of SEK188.1, which frames the stock as modestly undervalued rather than stretched.
The gap between a premium earnings multiple and a DCF that points slightly below price raises a practical question for investors. Which signal should carry more weight for you: sentiment around recent performance, or the cash flows our model projects from here?
Look into how the SWS DCF model arrives at its fair value.
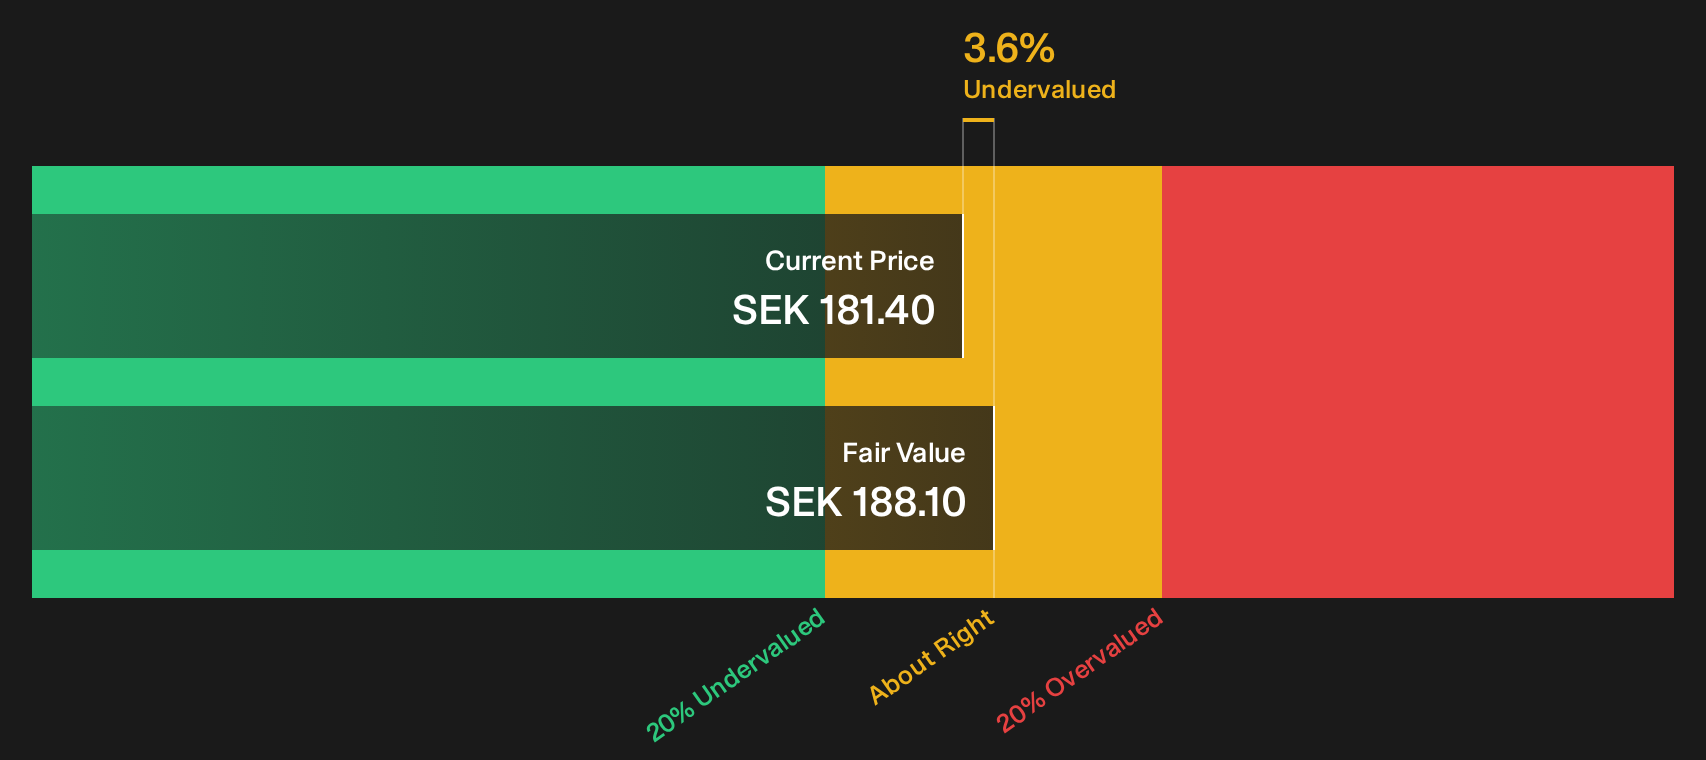
Simply Wall St performs a discounted cash flow (DCF) on every stock in the world every day (check out OEM International for example). We show the entire calculation in full. You can track the result in your watchlist or portfolio and be alerted when this changes, or use our stock screener to discover 192 high quality undervalued stocks. If you save a screener we even alert you when new companies match - so you never miss a potential opportunity.
Next Steps
If this mix of optimism and caution around OEM International leaves you uncertain, consider taking a closer look at the numbers yourself. To understand why some investors are upbeat despite the valuation debate, review the 3 key rewards
Looking for more OEM International style investment ideas?
If OEM International has sharpened your focus on quality, do not stop here. The next step is lining up a wider watchlist of candidates.
- Target resilient balance sheets and cleaner fundamentals by scanning the list of solid balance sheet and fundamentals (206 results) before capital moves elsewhere.
- Zero in on potential value with the 192 high quality undervalued stocks and give yourself a head start on opportunities others might overlook.
- Boost your income focus by reviewing the 168 dividend fortresses so you are not the one hearing about reliable yields after they move.
This article by Simply Wall St is general in nature. We provide commentary based on historical data and analyst forecasts only using an unbiased methodology and our articles are not intended to be financial advice. It does not constitute a recommendation to buy or sell any stock, and does not take account of your objectives, or your financial situation. We aim to bring you long-term focused analysis driven by fundamental data. Note that our analysis may not factor in the latest price-sensitive company announcements or qualitative material. Simply Wall St has no position in any stocks mentioned.
Have feedback on this article? Concerned about the content? Get in touch with us directly. Alternatively, email editorial-team@simplywallst.com