


Yancoal Australia (ASX:YAL) Faces A Premier Coal Strike, Is The Upside Already Priced In?
A strike at Yancoal Australia (ASX:YAL) Premier Coal mine has begun after roughly 91.5% of workers rejected a proposed workplace agreement, raising questions about future production stability and cost outcomes for the business.
Yancoal Australia shares last closed at A$5.71, with a 1-day share price return of 1.96% and a year-to-date share price gain of 13.97%. The 1-year total shareholder return of 11.39% and 5-year total shareholder return of 185.42% show that longer term holders have still seen strong overall outcomes, despite a recent 30-day share price decline of 5.93% as investors weigh the strike against a 3-year total shareholder return of 39.02%.
Scan how other coal and resource producers stack up on payout resilience, operational risk, and recent returns by checking the hand picked 3 dividend fortresses alongside Yancoal Australia.
The strike and recent pullback frame the question clearly. At A$5.71, does Yancoal Australia still offer a payoff that compensates you for the operational noise, or has most of the upside already been taken?
Preferred P/E of 25.6x for Yancoal Australia: Is it justified?
On the numbers alone, Yancoal Australia looks mixed. The stock trades at a P/E of 25.6x, which the data calls "good value" versus peers on one measure, but also "expensive" against both its industry and an estimated fair P/E.
The P/E ratio compares the current share price with earnings per share and, for a miner like Yancoal Australia, it reflects what investors are willing to pay for each dollar of profit in a sector where earnings can be heavily influenced by commodity cycles and operational swings. A higher P/E can point to the market expecting stronger profit growth or treating recent earnings as temporarily depressed.
Here, the signals pull in different directions. The P/E of 25.6x is described as good value compared with a peer group average of 33.9x. This suggests the market is paying less for each dollar of Yancoal Australia earnings than it is for similar stocks. Yet that same 25.6x multiple is tagged as expensive against the Australian Oil and Gas industry average of 16.2x, and also above an estimated fair P/E of 20.4x that the data implies the valuation could gravitate toward over time.
The gap is large and clear. The current 25.6x sits well above the 16.2x sector level and above the 20.4x fair P/E estimate, which sends a strong message that the market is assigning a richer earnings multiple than both the wider industry and the modelled fair ratio.
Explore the SWS fair ratio for Yancoal Australia.
Result: Price-to-earnings of 25.6x (OVERVALUED).
Still, the Yancoal Australia story can unravel fast if the Premier Coal strike drags on, or if earnings fall away while that 25.6x P/E holds.
Find out about the key risks to this Yancoal Australia narrative.
Another View on Yancoal Australia: DCF says deeply undervalued
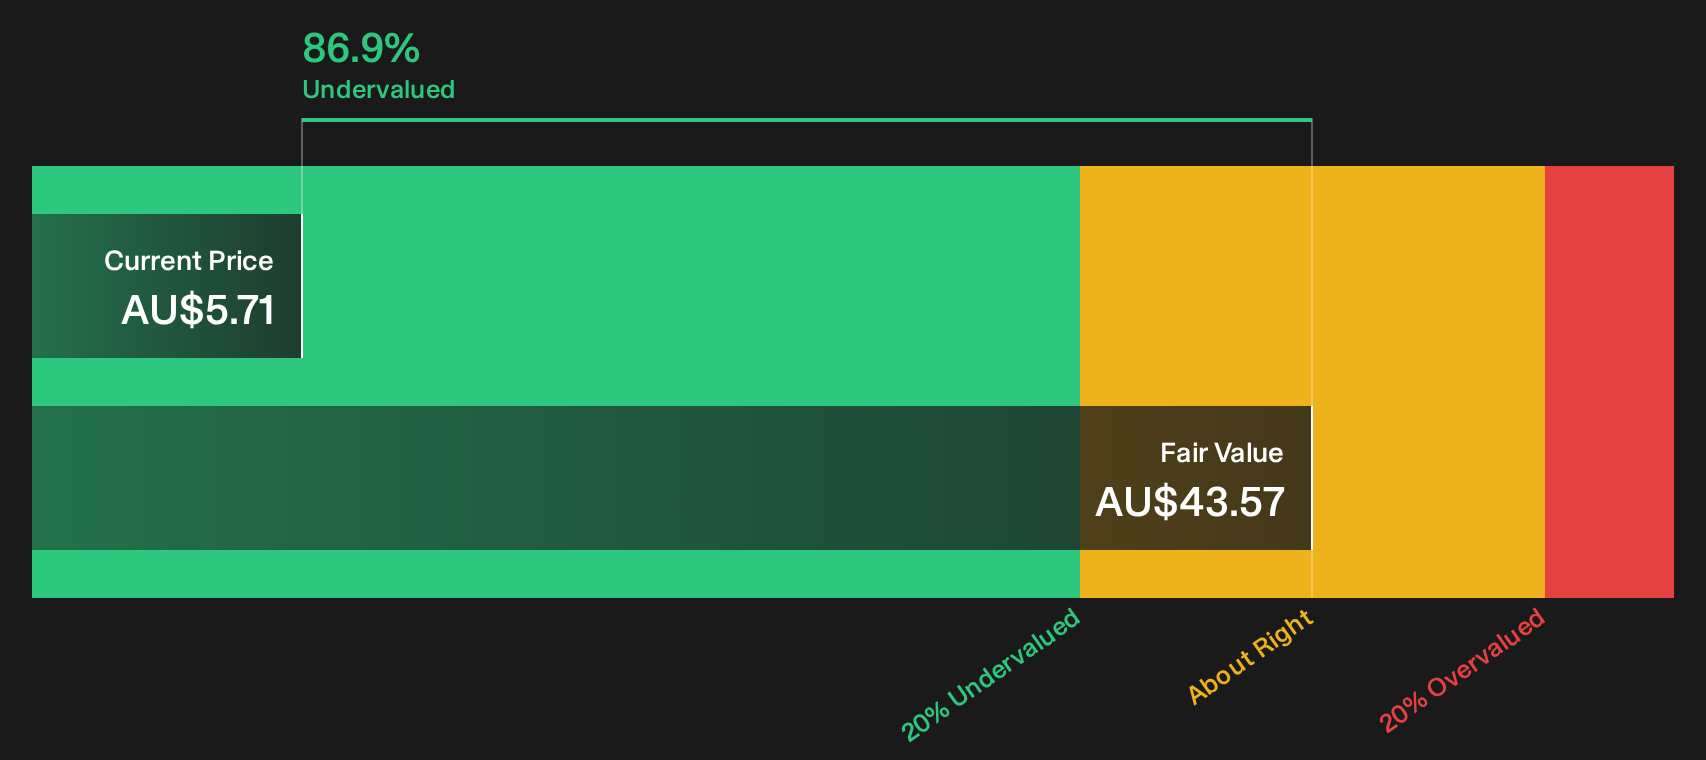
The P/E work presents Yancoal Australia as expensive at 25.6x, yet the SWS DCF model points in the opposite direction. At A$5.71, the shares are described as trading well below an estimated future cash flow value of A$43.57, which frames a very different risk and reward balance.
The contrast is stark. One lens flags overvaluation compared with a 20.4x fair ratio and a 16.2x sector level, while the cash flow model suggests a large gap between price and estimated value. When two tools disagree this much, which one do you rely on in your analysis?
Look into how the SWS DCF model arrives at its fair value.
Simply Wall St performs a discounted cash flow (DCF) on every stock in the world every day (check out Yancoal Australia for example). We show the entire calculation in full. You can track the result in your watchlist or portfolio and be alerted when this changes, or use our stock screener to discover 5 high quality undervalued stocks. If you save a screener we even alert you when new companies match - so you never miss a potential opportunity.
Next Steps
Mixed signals around Yancoal Australia valuation and risks do not wait for anyone, so get comfortable with the data quickly and stress test your own thesis with the 2 key rewards and 2 important warning signs.
Looking for more investment ideas beyond Yancoal Australia?
If Yancoal Australia has sharpened your focus on risk, reward, and timing, do not stop here. Broader idea hunting can reshape your whole portfolio.
- Target resilient balance sheets by scanning the list of solid balance sheet and fundamentals (12 results) which prioritises financial strength when conditions get tougher.
- Hunt for potential mispricing with the 5 high quality undervalued stocks which filters companies combining quality fundamentals with cheaper valuations.
- Lock in income focused ideas through the 3 dividend fortresses which highlights higher yielding businesses with stronger payout support.
This article by Simply Wall St is general in nature. We provide commentary based on historical data and analyst forecasts only using an unbiased methodology and our articles are not intended to be financial advice. It does not constitute a recommendation to buy or sell any stock, and does not take account of your objectives, or your financial situation. We aim to bring you long-term focused analysis driven by fundamental data. Note that our analysis may not factor in the latest price-sensitive company announcements or qualitative material. Simply Wall St has no position in any stocks mentioned.
Have feedback on this article? Concerned about the content? Get in touch with us directly. Alternatively, email editorial-team@simplywallst.com