


ITT (ITT) As Raised Estimates Leave Shares Near Fair Value
ITT (ITT) drew fresh attention after a hammer pattern formed on its chart, paired with higher consensus earnings estimates that shifted sentiment and pushed the stock into a Zacks Rank #2.
Recent trading tells a mixed story for ITT. The 1 day share price return of 2% and 90 day share price return of 10.37% point to building momentum, while the 1 year total shareholder return of 14.7% sits against a much stronger 3 year total shareholder return of 115.97%.
Scan for other industrials showing similar technical support and upgraded earnings momentum by running the 31 resilient stocks with low risk scores together with ITT on your watchlist.
ITT appears to be a solid industrial platform with healthy earnings momentum and a long operating history. The key question now is whether a share price of US$206 still leaves enough value on the table.
Most Popular Narrative: 1% Overvalued
On the most followed narrative, ITT screens slightly rich, with a fair value of $204.53 set against the last close at $206.17, which puts a lot of weight on execution against a detailed set of growth and margin assumptions.
The assumed bearish price target for ITT is $204.53, which represents up to two standard deviations below the consensus price target of $256.15. This valuation is based on what can be assumed as the expectations of ITT's future earnings growth, profit margins and other risk factors from analysts on the more bearish end of the spectrum.
See why 0 investors see ITT as 1% overvalued.
Result: Fair Value of $204.53 (OVERVALUED)
Still, if ITT struggles to convert its nearly US$2b backlog or encounters setbacks integrating FLOW and recent acquisitions, this slightly rich valuation case could unravel quickly.
Find out about the key risks to this ITT narrative.
Another View: ITT Through The Cash Flow Lens
The first narrative frames ITT as 1% overvalued on an earnings based fair value of $204.53. A different lens tells a different story. Our DCF model points to a future cash flow value of $239.34, with the current $206.17 price trading below that estimate. Which signal do you trust more when the cash flows and the multiple are not pointing in the same direction?
Investors who want to see how those cash flow assumptions are built into the model can Look into how the SWS DCF model arrives at its fair value.
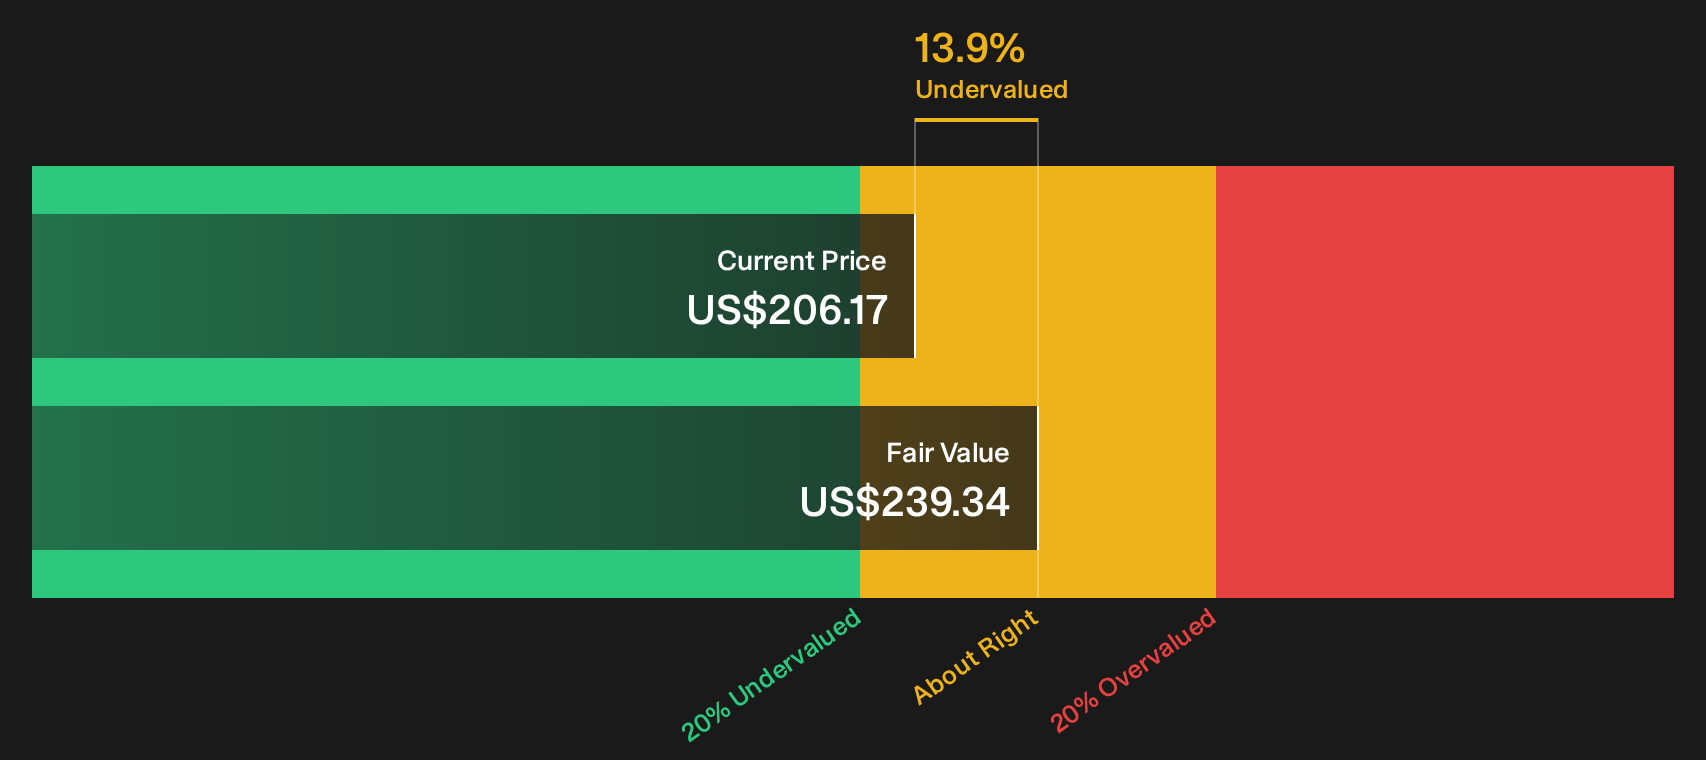
Simply Wall St performs a discounted cash flow (DCF) on every stock in the world every day (check out ITT for example). We show the entire calculation in full. You can track the result in your watchlist or portfolio and be alerted when this changes, or use our stock screener to discover 31 high quality undervalued stocks. If you save a screener we even alert you when new companies match - so you never miss a potential opportunity.
Next Steps
Mixed signals on ITT so far. If the story feels incomplete, move quickly, review the full data set, and weigh the 3 key rewards and 2 important warning signs.
Looking for more investment ideas beyond ITT?
If ITT has sharpened your interest, do not stop here. Fresh opportunities constantly surface, and widening your watchlist now could shape your next big decision.
- Target resilience by scanning a 31 resilient stocks with low risk scores that aims to reduce nasty surprises when markets turn against weaker balance sheets.
- Hunt for mispriced potential through the 31 high quality undervalued stocks and see which businesses the data suggests may trade below their fundamentals.
- Build a cash flow anchor with the 7 dividend fortresses and focus on companies offering income that can complement price returns over time.
This article by Simply Wall St is general in nature. We provide commentary based on historical data and analyst forecasts only using an unbiased methodology and our articles are not intended to be financial advice. It does not constitute a recommendation to buy or sell any stock, and does not take account of your objectives, or your financial situation. We aim to bring you long-term focused analysis driven by fundamental data. Note that our analysis may not factor in the latest price-sensitive company announcements or qualitative material. Simply Wall St has no position in any stocks mentioned.
Have feedback on this article? Concerned about the content? Get in touch with us directly. Alternatively, email editorial-team@simplywallst.com