


Ellington Financial (EFC) Stock Looks Below Fair Value Based On Earnings
Ellington Financial has delivered a mixed share price story, with recent weakness sitting alongside a stronger multi year record, which puts the focus squarely on what investors are paying for its earnings today. With the stock changing hands at around US$11.69 at the last close, the key issue is how that price squares with the profit engine behind this mortgage and credit focused business.
- Over the past 3 years, Ellington Financial has returned about 38.7%, which raises the question of whether that performance still lines up with the earnings power underpinning the stock.
- The firm’s model of investing in mortgage and credit assets means valuation hinges on how reliably it can convert that portfolio into consistent earnings while managing funding costs and credit risk.
- There is a second opinion on Ellington Financial worth weighing. See what analysts think Ellington Financial's shares could be worth.
The stock’s next move may depend on whether the current share price is adequately supported by Ellington Financial’s earnings profile.
This type of earnings-focused question on Ellington Financial is easier to evaluate when you compare it with a broader group of companies screened for 28 high quality undervalued stocks
Is Ellington Financial a Bargain on Earnings?
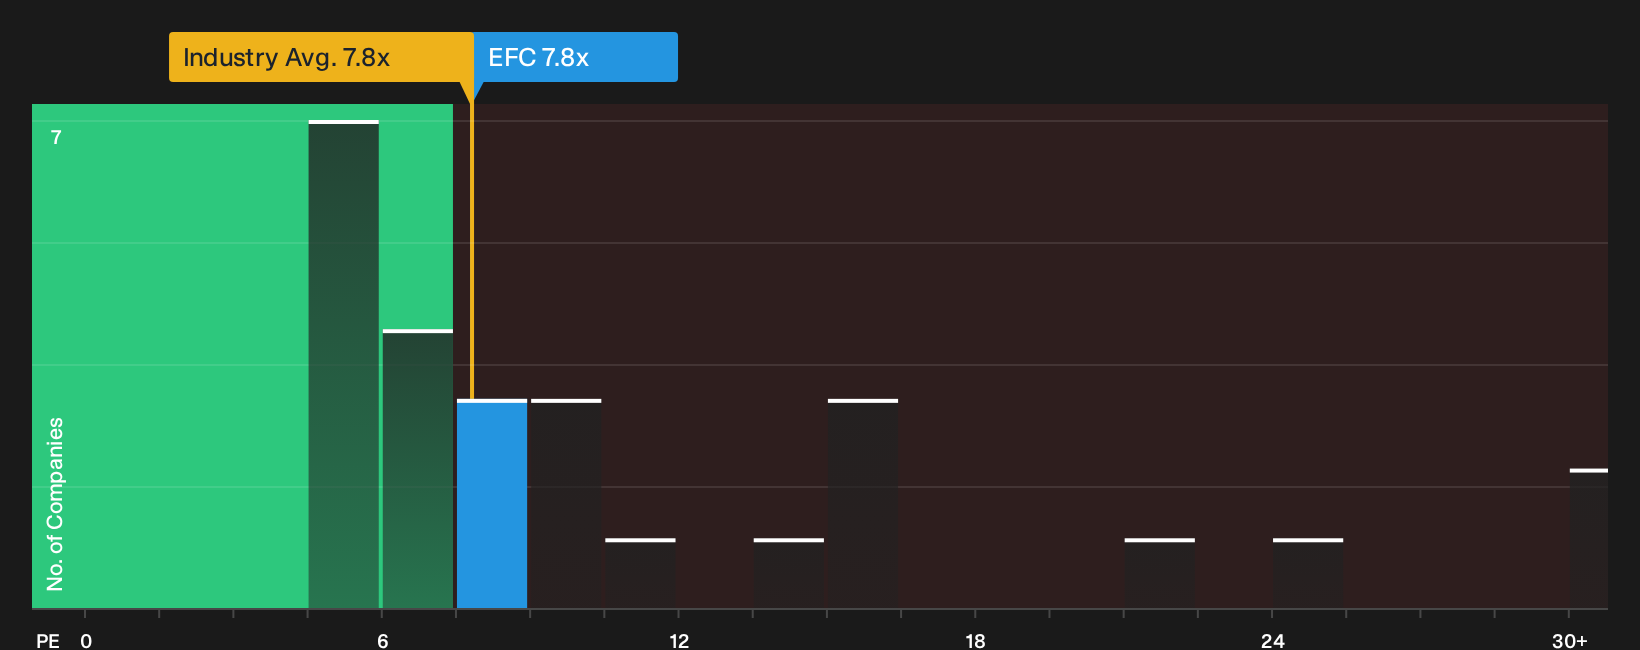
P/E is a useful lens for Ellington Financial because earnings are central to how investors judge a mortgage REIT’s ability to support its payout and equity base. On this measure, the stock trades on a P/E of 7.8x, which is effectively in line with the broader Mortgage REITs group at about 7.8x as well. Against a wider peer set screened on earnings, the average multiple is much higher at about 40.2x, so Ellington Financial changes hands on a far lower earnings tag than many income focused financials.
The valuation model that blends the company’s forecast return on equity, book value profile and risk inputs points to a higher P/E than where the shares trade today. That gap means the current earnings multiple screens as undervalued relative to what the model suggests for Ellington Financial’s characteristics, rather than just looking low compared with a noisy peer sample. Explore the numbers behind Ellington Financial's P/E valuation.
The Ellington Financial Narrative: What Would Justify Today's Price?
Ellington Financial’s valuation puzzle invites a natural follow up question. Simply Wall St Narratives set out the specific earnings, margin and growth paths that would need to hold for the shares to be worth materially more or less than today’s price, and each one treats Ellington Financial's fair value as a hypothesis about how the business might evolve over time so you can see how that thesis holds up on the Community page.
A clear, quantified narrative on Ellington Financial helps turn a broad view about its earnings and valuation into a set of concrete assumptions that can be checked against future results. As new data arrives, those written expectations give you a reference point to judge whether Ellington Financial's growth, margins and execution are tracking closer to upside or downside scenarios.
Share your own Narrative for Ellington Financial and set out the assumptions behind your valuation.
Before acting on Ellington Financial’s valuation, there is one more angle to check
The numbers only tell part of the story, because the people steering Ellington Financial and the way their pay is structured can strongly shape risk, capital decisions and future earnings quality. See who runs Ellington Financial and how they are paid.
This article by Simply Wall St is general in nature. We provide commentary based on historical data and analyst forecasts only using an unbiased methodology and our articles are not intended to be financial advice. It does not constitute a recommendation to buy or sell any stock, and does not take account of your objectives, or your financial situation. We aim to bring you long-term focused analysis driven by fundamental data. Note that our analysis may not factor in the latest price-sensitive company announcements or qualitative material. Simply Wall St has no position in any stocks mentioned.
Have feedback on this article? Concerned about the content? Get in touch with us directly. Alternatively, email editorial-team@simplywallst.com