


Why Has Gold Been Stuck in Neutral?
I asked if gold could reach another new high before the end of 2026 in an August 11, 2026, Barchart article, where I concluded with the following:
I am bullish on gold but realize that the current bearish trend could take prices lower. If gold is going to make a new high in 2026, as JP Morgan analysts expect, it will need to find a bottom soon and begin forming higher lows and higher highs, with fewer than five months left in this year.
Nearby COMEX gold futures traded $4,423 per ounce on August 10, and were lower at around $4,200 in early October. Time will tell if gold is building cause for another leg higher or if the consolidation will continue into 2027.
A bearish trend in 2026
After reaching a record high of $5,626.80 per ounce on January 29, 2026, COMEX gold futures have made lower highs and lower lows, falling 29.7% to $3,955.40 on June 30.
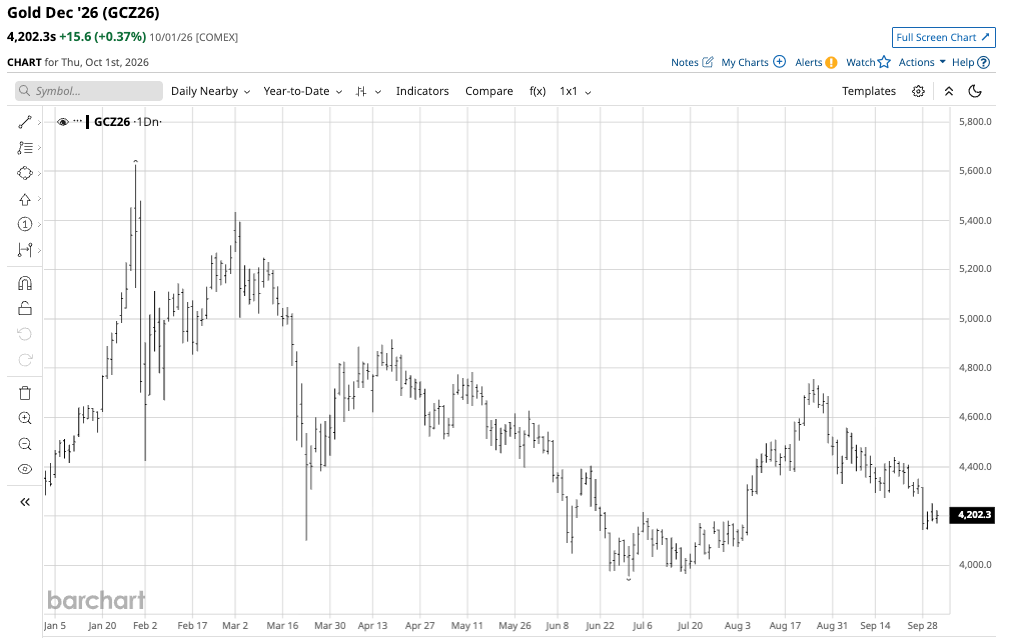
The daily continuous year-to-date COMEX gold futures chart shows that gold futures have recovered, rallying 20.2% to a high of $4,755 per ounce on August 25. At $4,200 in early October, gold was around $150 below the midpoint of its trading range since the June 30 low.
A long-term bullish trend for over two and a half decades
In 1999, COMEX gold futures hit a low of $252.80 per ounce.
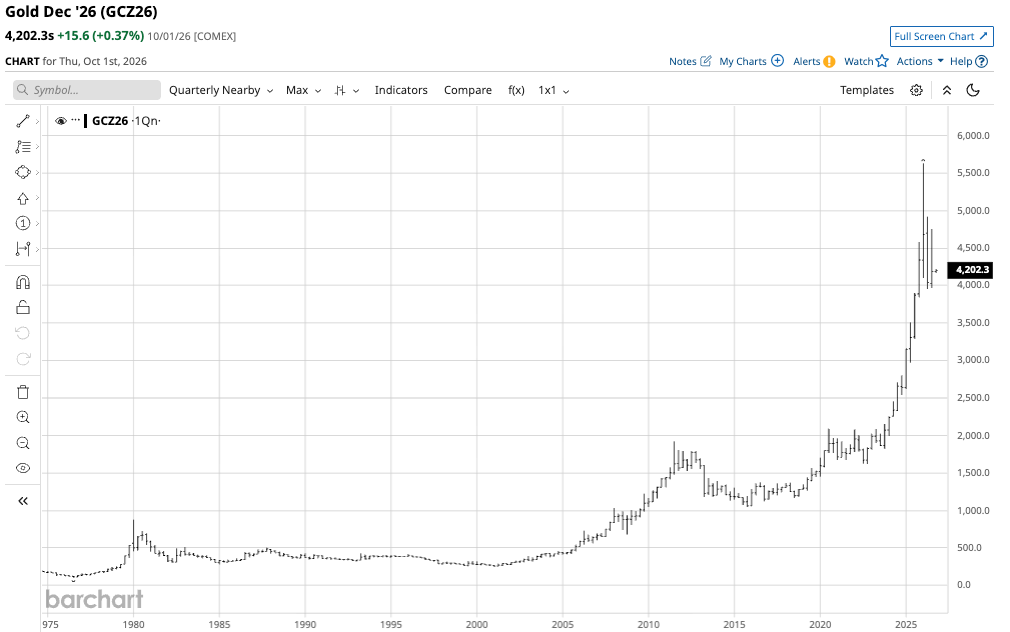
The long-term quarterly chart shows that gold has been in a bullish trend for more than a quarter of a century. While the price has declined from the late January 2026 record high, more than 22 times higher than the 1999 low, the bullish trend remains intact at over $4,200 per ounce in early October 2026. Technical resistance sits at the early 2026 high, while long-term technical support is at the Q3 2020 high of $2,089.20 per ounce. Gold would have to halve in value to threaten the bullish trend since before the turn of this century.
Trimmed forecasts reflect the current price action and are meaningless
When gold was on the march higher in late 2025 and early 2026, many analysts at leading financial institutions kept raising their forecasts, projecting that gold prices would rise to over $6,000, with some targeting even higher prices. Ironically, in early 2025, when gold traded around $3,000 per ounce, few predicted that it would rise to over $5,600.
After gold’s overdue correction, analysts have trimmed forecasts. Financial institutions with $6,000 targets have revised their expectations, with every major bank lowering its forecasts. JPMorgan is now at $4,500 for the end of 2026, with Wells Fargo at $4,900-$5,100. Goldman Sachs is at $4,900, and UBS is the highest at $5,5090, still below the late January 2026 record high.
The bottom line is that analysts at leading financial institutions that trade gold have not been successful with their forecasts. Gold’s path of least resistance depends on many factors, including economic and geopolitical events, but the main driver of gold’s future price is sentiment that drives investment demand. As with all markets, gold will rise if buyers outnumber sellers and fall if sellers dominate buyers. Therefore, projecting the gold price is a meaningless exercise. Traders and investors are better off following the flow and trend than analysts’ recommendations.
Buying gold on price weakness has been optimal since 1999
One constant from the 1999 low through the 2026 high: buying gold during corrections has been optimal.
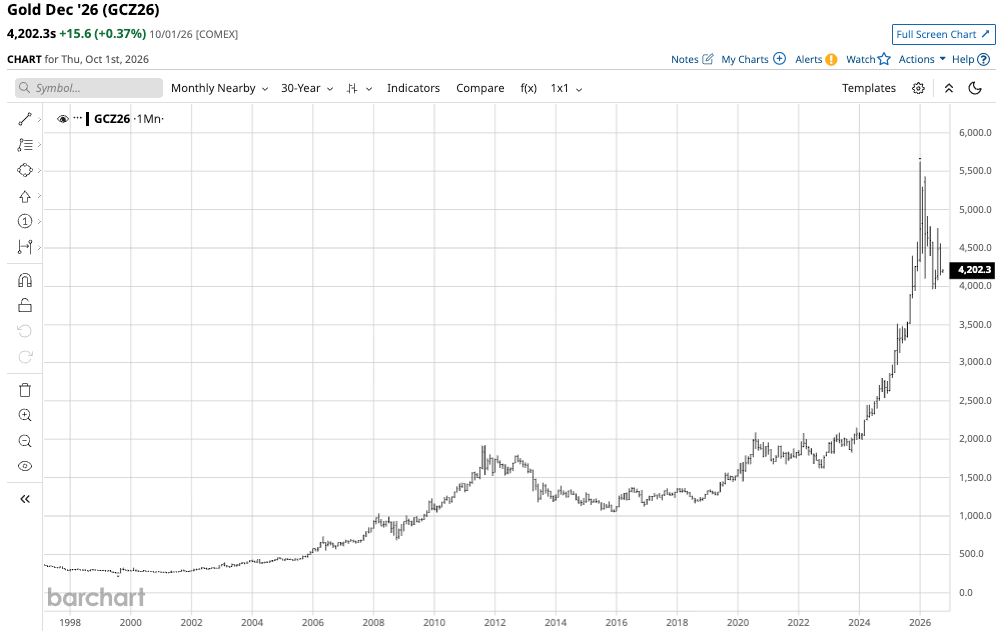
The 30-year monthly continuation COMEX gold futures chart demonstrates that buying gold when the price declines for the long term has resulted in profits. While the prolonged correction from the September 2011 high to the December 2015 low required patience and a scale-down approach that left plenty of room to accumulate gold at lower prices, other corrections were shorter, with gold prices correcting from the August 2020 high to the March 2021 low and from the March 2022 high to the November 2022 low, which required less patience, and buying or adding to long positions on other short-term corrections provided more immediate results. The latest correction took gold from the record high in late January 2026 to the most recent bottom in June 2026. Time will tell whether a scale-down buying approach will yield results similar to those over the past two and a half decades.
The case for gold and the risks in October 2026
The gold market has changed dramatically in recent years, driven by fiat currency depreciation and central banks’ commitment to add to gold reserves. While the U.S. dollar remains the world’s reserve currency, gold replaced the euro as the second-largest reserve asset in 2025. Central banks, governments, monetary authorities, and supranational institutions continue to validate gold’s rising role in the global financial system. In 2026, central banks have continued to be net gold buyers.
China and Russia are the world’s two leading gold-producing countries. While governments publish gold holdings, China and Russia treat commodity reserves as national security matters. Therefore, they likely have been accumulating domestic production to add to reserves, understating their overall holdings. Aside from the importance of government gold reserve building, the following factors support higher gold prices in October 2026:
- Inflation is the legacy of the 2020 global pandemic. Government stimulus and unprecedentedly low interest rates fueled today’s stubborn inflation and debt levels. Historically, gold’s price responds to inflation by moving higher.
- Wars in Ukraine and the Middle East, and the potential for other geopolitical hotspots, tend to support higher gold prices.
- Gold has become more accessible to individual investors over the past years through gold ETFs products like GLD, IAU, BAR, and others that invest in physical gold bullion and are available in standard equity investment accounts. This availability has expanded gold’s addressable market, fueling the bull market over the past years.
- Tariffs, sanctions, and other trade issues have driven de-dollarization in cross-border transactions. Gold has a long history as the ultimate currency or means of exchange that transcends individual government controls.
- The bifurcation of the world’s nuclear powers has further fueled the trend toward de-dollarization, supporting gold’s role and the adoption of other assets such as Bitcoin and cryptocurrencies. While cryptocurrencies have gained acceptance, gold remains the world’s oldest and most valued means of exchange and reserve asset.
- Gold’s industrial applications only add to its allure as a financial asset. No fiat currencies or cryptocurrencies possess that dual role.
- Gold’s trend remains bullish as it moves toward its 27th year of rising prices. Gold reached new record highs in 2026, 2025, 2024, and 2023. Time will tell if 2027 will be the fifth consecutive year of a new all-time price peak.
While there is a compelling case for gold’s rally to continue, even the most aggressive bull markets rarely move in straight lines. As market participants and gold investors learned in late January 2026, the higher prices rise, the greater the odds of downside corrections. Rising U.S. interest rates and a strong U.S. dollar are typically bearish factors for gold and other commodity prices. The U.S. Federal Reserve’s FOMC raised the short-term Fed Funds Rate by 25 basis points to a midpoint of 3.875% in September 2026, citing stubborn inflation above its 2% target. The Fed uses the short-term rate as its primary monetary policy tool to achieve its mandate of stable prices and full employment. However, market forces determine interest rates further along the yield curve.
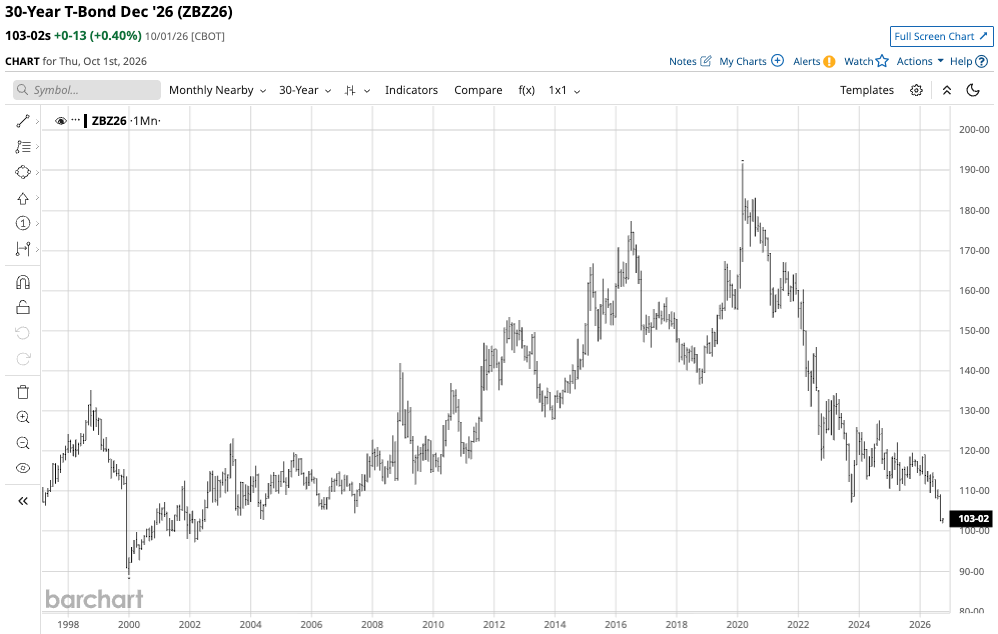
The monthly continuous chart of 30-year U.S. Treasury Bond futures shows that long bond futures fell below the October 2023 low of 107-04 and the critical technical support level in September 2026, reaching 101-29, the lowest level since June 2002. Meanwhile, U.S. rates are rising because of inflation and U.S. debt, which has risen to over $40 trillion. If the dollar begins to decline with interest rates rising, it could have the opposite impact on gold, defying the historical bearish signal.
Another factor that could weigh on gold over the coming months is a broader risk-off period across all asset classes. Risk-off conditions tend to send all asset prices lower, and gold may be no exception. Many investors have purchased gold over the past years. Risk-off conditions could also trigger forced selling to meet margin calls in other asset markets.
The path of least resistance for gold prices over the coming weeks and months will reflect market sentiment and exogenous factors. There remains a compelling case for owning gold and adding to long positions on price weakness. While buying gold on price weakness has been optimal since 1999, the current correction could continue. I would view a prolonged period of lower lows as a golden opportunity to add to long-term investment positions.
Gold is stuck in neutral in October 2026. Bullish and bearish factors are pulling the precious metal in opposite directions. With critical long-term technical support at half the current price, the potential for wide price swings is high. If gold’s price falls, I would view the weakness as an opportunity to accumulate the world’s oldest asset, but leave plenty of room to accumulate, as it is virtually impossible to pick price bottoms in markets, and gold is no exception.
On the date of publication, Andrew Hecht did not have (either directly or indirectly) positions in any of the securities mentioned in this article. All information and data in this article is solely for informational purposes. For more information please view the Barchart Disclosure Policy here.