


Global Penny Stocks Spotlight: Xinyi Solar Holdings And 2 Promising Picks
As global markets navigate a landscape marked by inflation concerns and fluctuating interest rates, investors are increasingly looking towards alternative investment opportunities. Penny stocks, often associated with smaller or newer companies, continue to capture attention for their potential to offer growth at accessible price points. Despite the vintage feel of the term, these stocks can present valuable opportunities when backed by strong financials and solid fundamentals.
We'll examine a selection from our screener results.
Xinyi Solar Holdings (SEHK:968)
Simply Wall St Financial Health Rating: ★★★★★☆
Overview: Xinyi Solar Holdings Limited is an investment holding company that produces and sells solar glass products across Mainland China, Asia, North America, Europe, and other international markets with a market cap of HK$17.84 billion.
Operations: The company generates revenue primarily from the sale of solar glass, amounting to CN¥15.52 billion, and its renewable energy business, which contributes CN¥2.77 billion.
Market Cap: HK$17.84B
Xinyi Solar Holdings recently initiated a share buyback program, potentially enhancing its net asset value per share. Despite this strategic move, the company faces challenges with declining profitability; its recent half-year earnings report showed a significant drop in net income to CN¥39.02 million from CN¥745.76 million the previous year. The decline is attributed to reduced demand and selling prices for solar glass products and increased curtailment in renewable energy generation in Mainland China. Financially, Xinyi maintains strong short-term asset coverage over liabilities and satisfactory debt levels, though it contends with low return on equity and past large one-off losses impacting results.
- Click here and access our complete financial health analysis report to understand the dynamics of Xinyi Solar Holdings.
- Gain insights into Xinyi Solar Holdings' outlook and expected performance with our report on the company's earnings estimates.
Fangda Special Steel Technology (SHSE:600507)
Simply Wall St Financial Health Rating: ★★★★★★
Overview: Fangda Special Steel Technology Co., Ltd. operates in the steel industry, focusing on the production and sale of special steel products, with a market cap of approximately CN¥9.23 billion.
Operations: Fangda Special Steel Technology Co., Ltd. has not reported specific revenue segments.
Market Cap: CN¥9.23B
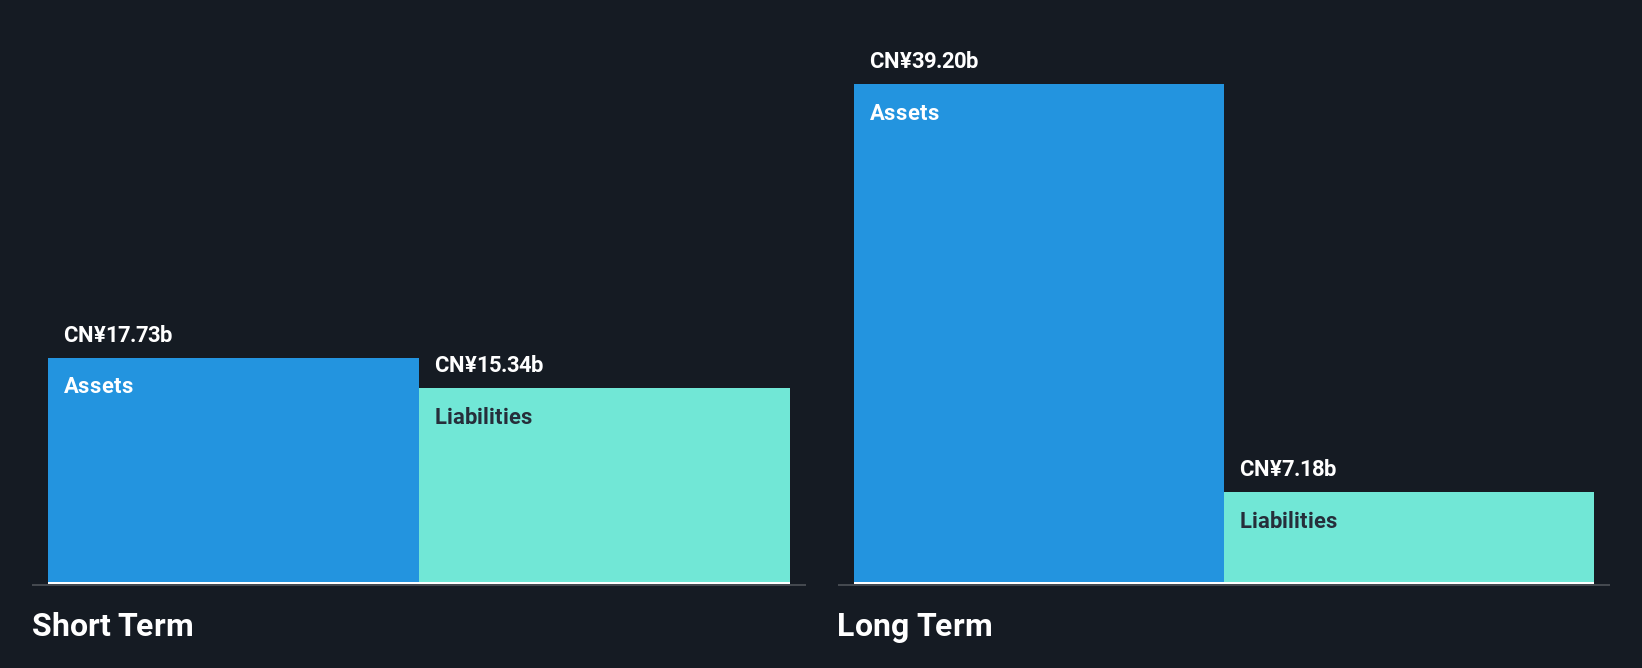
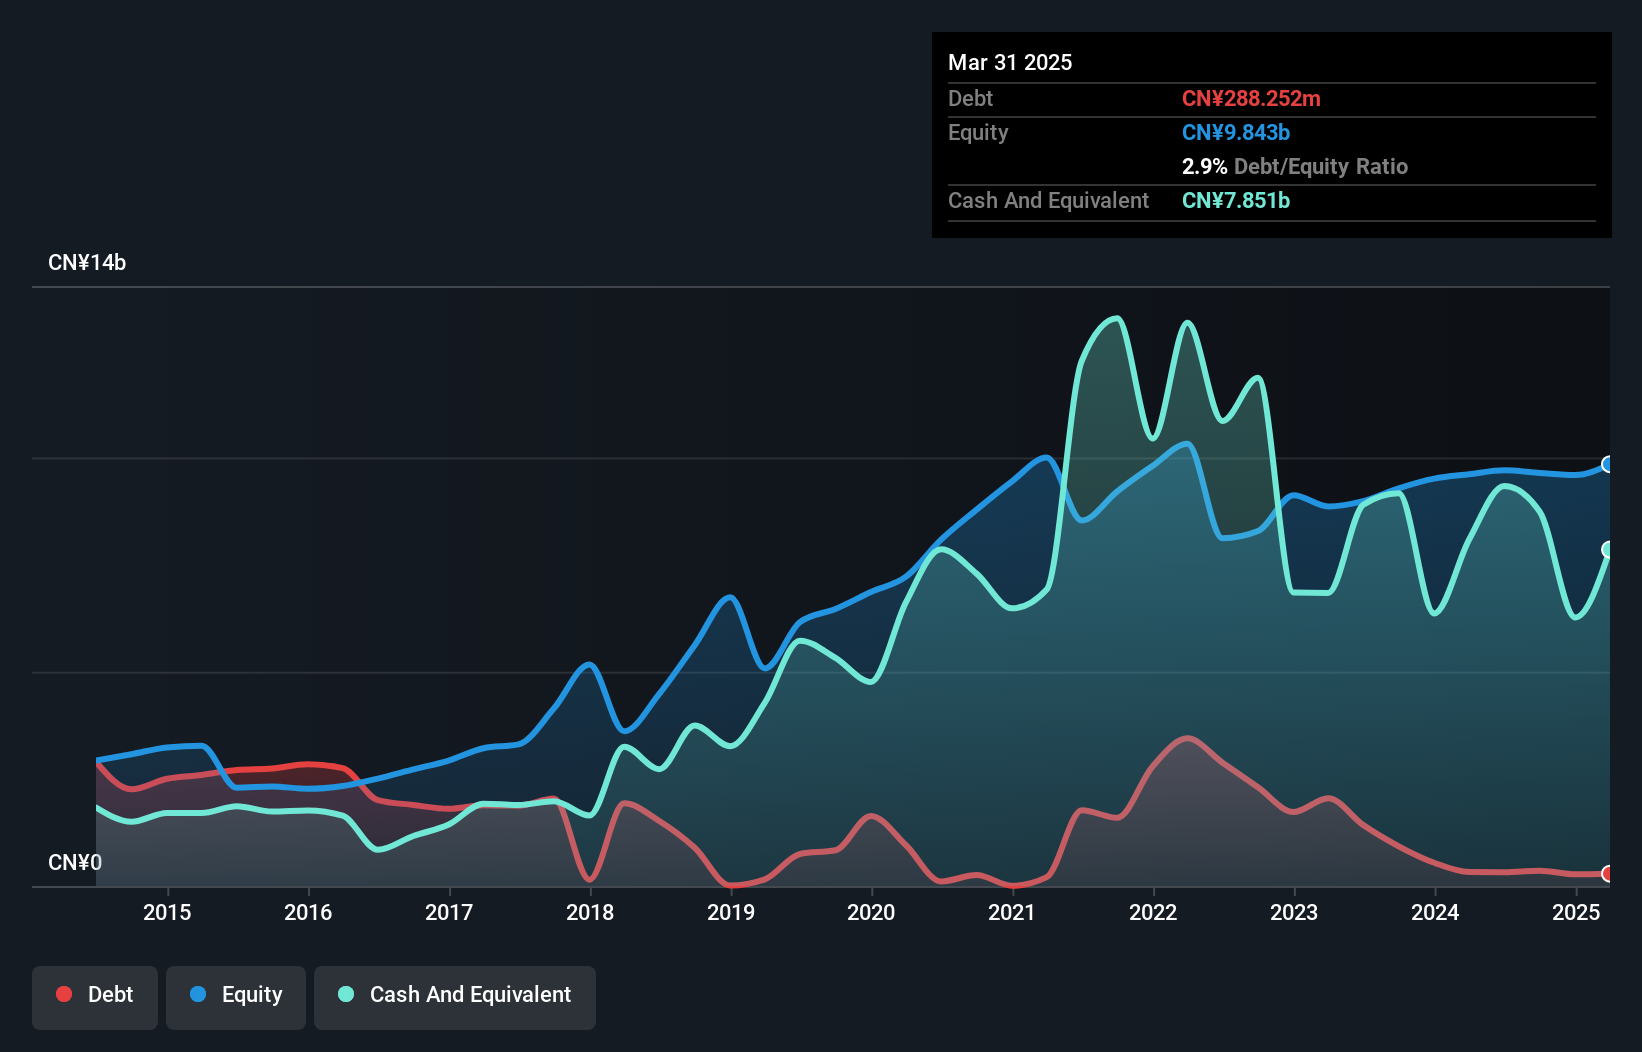
Fangda Special Steel Technology's recent performance reveals mixed signals for investors. While the company demonstrated robust earnings growth of 52.1% over the past year, surpassing industry averages, its revenue and net income for H1 2026 declined compared to the previous year, with net income falling to CN¥208.38 million from CN¥405.11 million. The firm maintains strong short-term asset coverage over liabilities and has reduced its debt-to-equity ratio significantly over five years, reflecting prudent financial management. However, a low return on equity at 7.4% and an inexperienced management team may pose challenges moving forward in sustaining growth momentum.
- Click to explore a detailed breakdown of our findings in Fangda Special Steel Technology's financial health report.
- Examine Fangda Special Steel Technology's earnings growth report to understand how analysts expect it to perform.
Hubei Fuxing Science and TechnologyLtd (SZSE:000926)
Simply Wall St Financial Health Rating: ★★★★☆☆
Overview: Hubei Fuxing Science and Technology Co., Ltd operates in the real estate development sector both within China and internationally, with a market capitalization of CN¥3.48 billion.
Operations: The company generates revenue primarily from its Real Estate Segment, which accounts for CN¥2.94 billion, and its Metal Products Division, contributing CN¥920.02 million.
Market Cap: CN¥3.48B
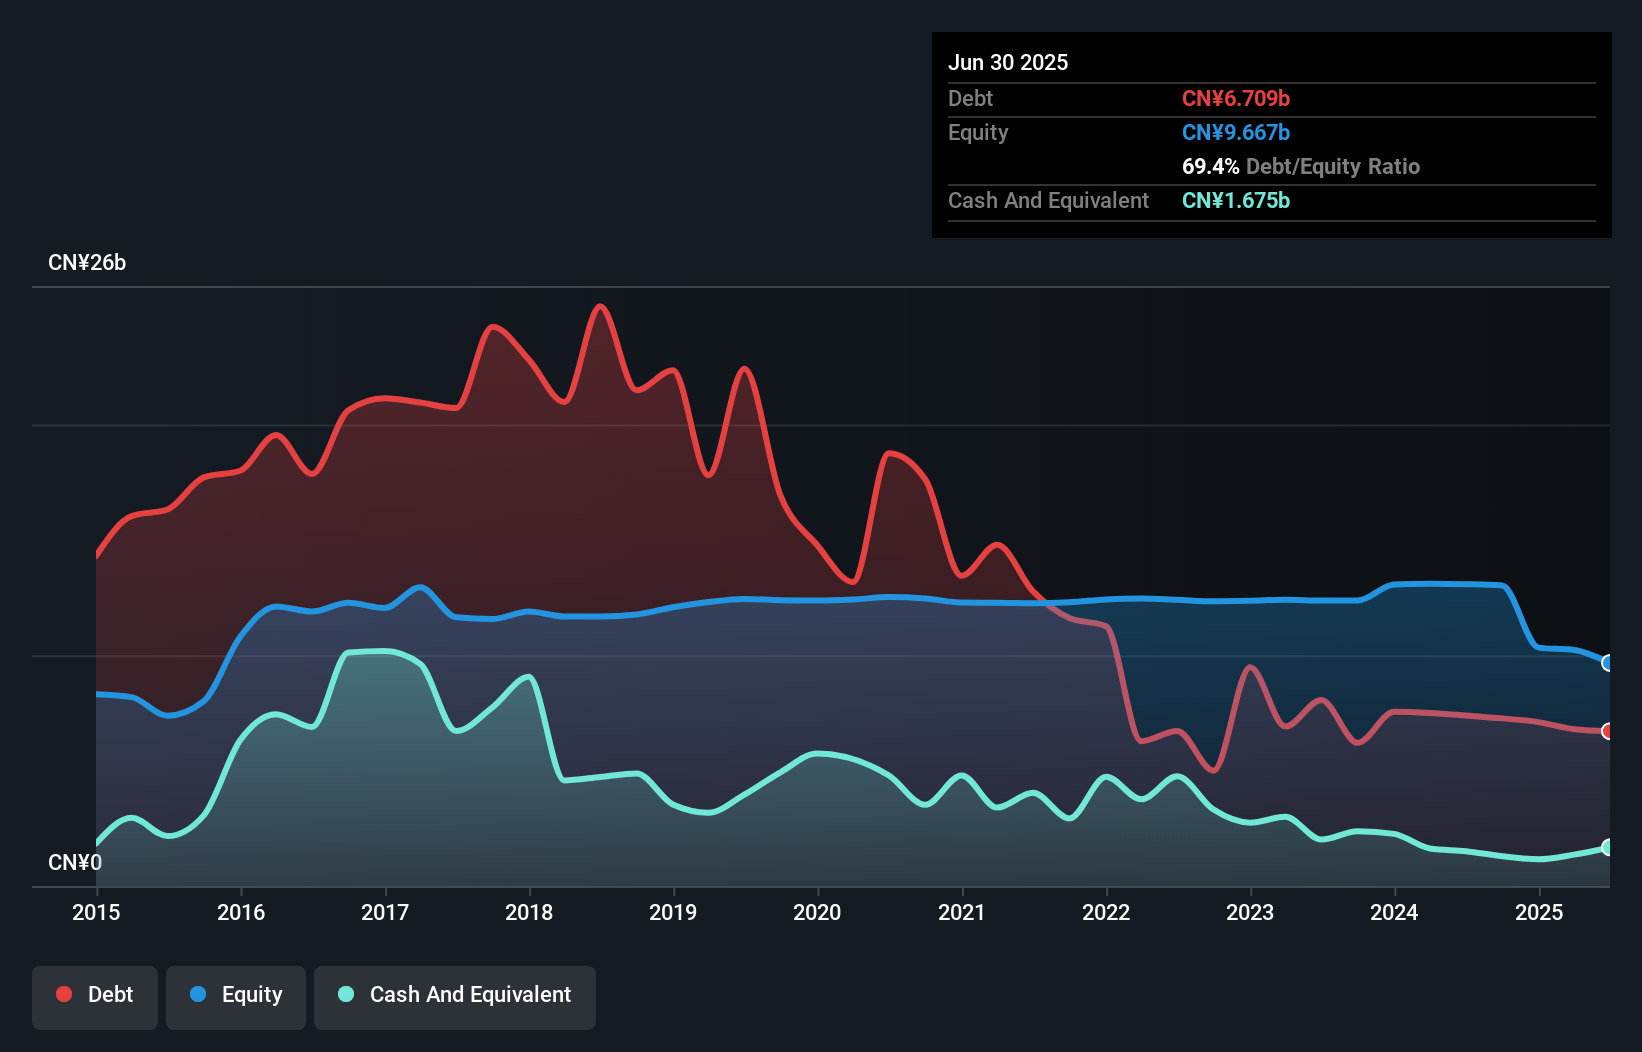
Hubei Fuxing Science and Technology Co., Ltd faces challenges as it remains unprofitable with increasing losses over five years. Despite trading at a significant discount to its estimated fair value, the company's high net debt to equity ratio of 128.2% is concerning. However, it boasts strong short-term asset coverage over liabilities and a seasoned management team with an average tenure of 7.5 years, ensuring some stability in operations. Recent earnings show increased revenue but also a widening net loss, highlighting difficulties in achieving profitability despite adequate cash runway for more than three years at current free cash flow levels.
- Get an in-depth perspective on Hubei Fuxing Science and TechnologyLtd's performance by reading our balance sheet health report here.
- Review our historical performance report to gain insights into Hubei Fuxing Science and TechnologyLtd's track record.
Summing It All Up
- Unlock more gems! Our Global Penny Stocks screener has unearthed 3,586 more companies for you to explore.Click here to unveil our expertly curated list of 3,589 Global Penny Stocks.
- Searching for a Fresh Perspective? AI is about to change healthcare. These 131 stocks are working on everything from early diagnostics to drug discovery. The best part - they are all under $10b in market cap - there's still time to get in early.
This article by Simply Wall St is general in nature. We provide commentary based on historical data and analyst forecasts only using an unbiased methodology and our articles are not intended to be financial advice. It does not constitute a recommendation to buy or sell any stock, and does not take account of your objectives, or your financial situation. We aim to bring you long-term focused analysis driven by fundamental data. Note that our analysis may not factor in the latest price-sensitive company announcements or qualitative material. Simply Wall St has no position in any stocks mentioned.
Have feedback on this article? Concerned about the content? Get in touch with us directly. Alternatively, email editorial-team@simplywallst.com