


Roblox (RBLX) Could Be 74% Below Fair Value On A Split Valuation View
Roblox (RBLX) is back in focus after recent trading data showed a mixed performance, with the share price last closing at US$43. That move came alongside a gain over the past month and a decline over the past three months.
Zooming out, Roblox has had a choppy run, with the share price return down sharply year to date and over the past year. The recent 30 day share price gain contrasts with a weaker 90 day stretch and a steep 1 year total shareholder return decline that points to fading momentum and changing risk perceptions.
Pressure test Roblox against its peers by scanning our hand-picked 19 high quality undiscovered gems that have been filtered for strong fundamentals and relatively quieter share price moves.
So with Roblox back at US$43 after a bruising year, do you lean into the recent rebound, or hold out for an even cheaper entry before the numbers justify a move?
Most Popular Narrative: 100% Overvalued
Roblox closed at $43, while the most followed narrative pins fair value at $21.48. That gap reflects a view that the current price builds in far more optimism than the underlying model supports.
My realistic case would sit well below the $95.62 bull case, but still above the current price if Roblox executes reasonably well.
That is not a “moonshot” case. It is more like this: Roblox grows well, absorbs most dilution, becomes modestly GAAP profitable, and the market still gives it a premium multiple because free cash flow remains strong.
See why 9 investors see Roblox as 100% overvalued.
Result: Fair Value of $21.48 (OVERVALUED)
Still, Roblox faces real risk if safety costs stay elevated or older-user growth disappoints, which could pull free cash flow and valuation assumptions back to earth.
Find out about the key risks to this Roblox narrative.
Another View: Roblox Through The SWS DCF Lens
Roblox looks very different when you swap the community narrative for the SWS DCF model. On this view, the stock at $43 trades below an estimated future cash flow value of $74.77, which points to a meaningful upside gap rather than the 100% overvalued label.
That split in outcomes comes from the inputs you trust most. Price to sales multiples flag valuation risk, while our DCF model leans on future cash generation and suggests headroom if Roblox converts its growth into cash as expected. Which yardstick do you put more weight on when the signals disagree this sharply?
Look into how the SWS DCF model arrives at its fair value.
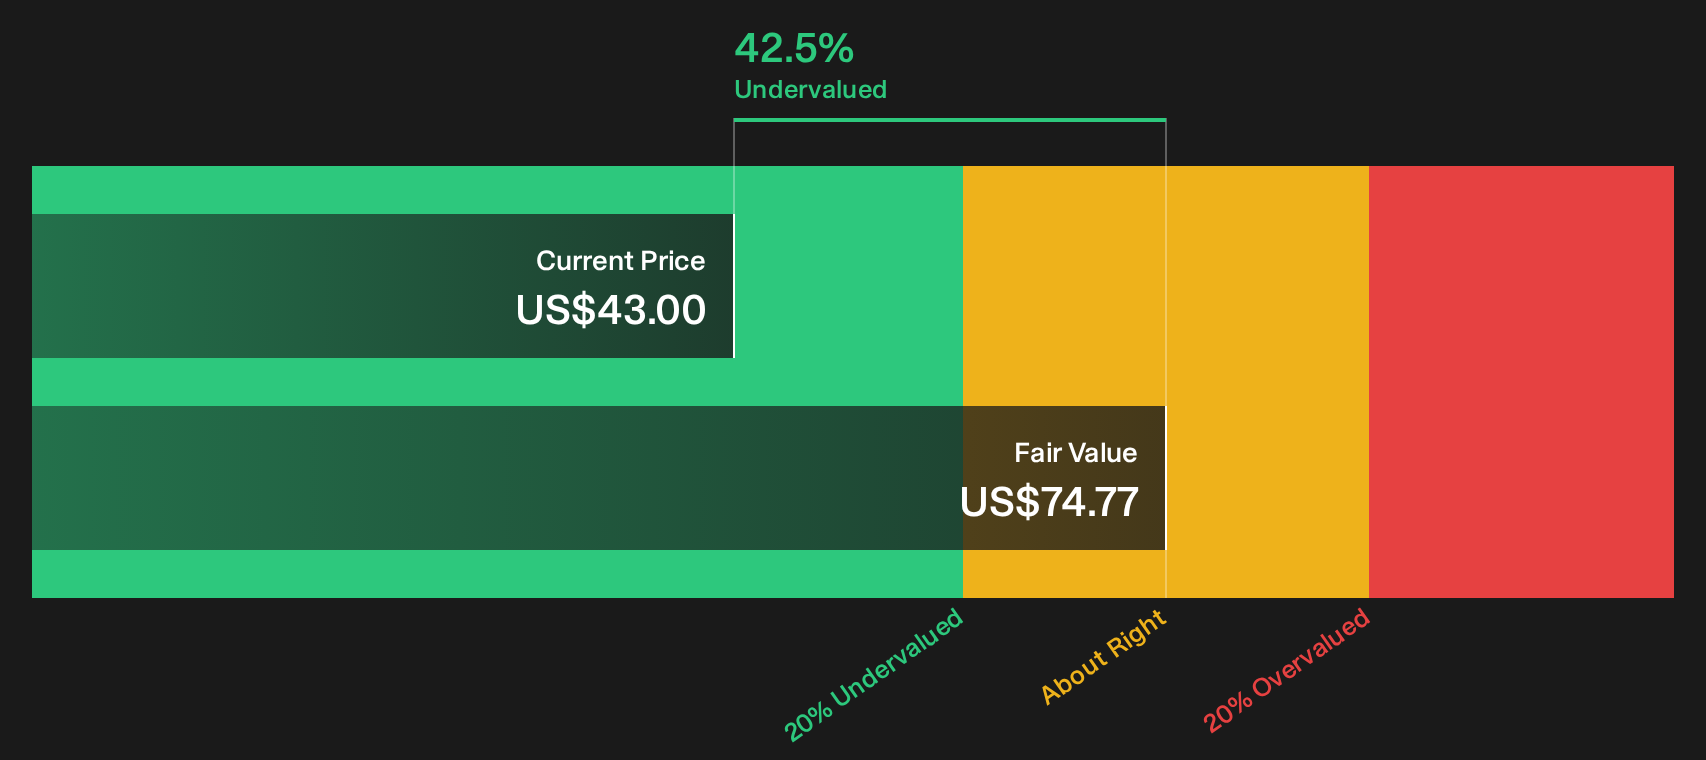
Simply Wall St performs a discounted cash flow (DCF) on every stock in the world every day (check out Roblox for example). We show the entire calculation in full. You can track the result in your watchlist or portfolio and be alerted when this changes, or use our stock screener to discover 27 high quality undervalued stocks. If you save a screener we even alert you when new companies match - so you never miss a potential opportunity.
Next Steps
With sentiment this divided on Roblox, you have a window right now to weigh the upside against the risks and decide where you stand. To pressure test your own thesis against both the concerns and the potential upside, start with our breakdown of 2 key rewards and 3 important warning signs
Looking for more Roblox investment ideas?
If Roblox has you rethinking your watchlist, do not stop there. Use the Simply Wall Street Screener to line up fresh opportunities before others move.
- Target dependable income streams by scanning companies described as 7 dividend fortresses and see which payouts might complement a growth focused portfolio.
- Reduce potential downside by reviewing 31 resilient stocks with low risk scores so you can balance Roblox with businesses that score well on financial resilience.
- Hunt for quality at a discount through 27 high quality undervalued stocks and compare those candidates to how Roblox currently stacks up in your portfolio.
This article by Simply Wall St is general in nature. We provide commentary based on historical data and analyst forecasts only using an unbiased methodology and our articles are not intended to be financial advice. It does not constitute a recommendation to buy or sell any stock, and does not take account of your objectives, or your financial situation. We aim to bring you long-term focused analysis driven by fundamental data. Note that our analysis may not factor in the latest price-sensitive company announcements or qualitative material. Simply Wall St has no position in any stocks mentioned.
Have feedback on this article? Concerned about the content? Get in touch with us directly. Alternatively, email editorial-team@simplywallst.com