


Ralliant (RAL) Gains Momentum, Is The Stock Fully Priced?
Ralliant (RAL) drew fresh attention after its latest share price move, with the stock closing at $69.17. Traders are weighing this level against the company’s mixed recent returns and widening loss profile.
That $69.17 share price comes after a strong year-to-date share price return of 35.04%, with a 30-day share price gain of 12.05% hinting at building momentum even though the 7-day move is slightly negative. Over the past year, total shareholder return of 57.22% shows that investors who held Ralliant through recent volatility have been materially rewarded.
Scan how Ralliant fits alongside other precision electronics players by reviewing the hand-picked 19 high quality undiscovered gems that share strong fundamentals but still sit under most investors’ radar.
That $69.17 price can mirror stronger conviction in Ralliant’s precision hardware franchises, or simply a sentiment swing around a loss-making story. Which explanation fits better once you line it up against the valuation metrics?
Most Popular Narrative: 10.3% Undervalued
Ralliant’s most followed valuation storyline pegs fair value at $77.10, above the recent $69.17 close, which puts the focus squarely on the long-term earnings rebuild that narrative assumes.
Planned growth focused CapEx at 2% to 3% of revenue and reinvestment of 50 to 100 basis points of margin into commercial, innovation and manufacturing initiatives are aimed at expanding capacity in defense and utilities and accelerating product refresh cycles, which can support medium term revenue growth and earnings power.
See why 1 investors see Ralliant as 10% undervalued.
Result: Fair Value of $77.10 (UNDERVALUED)
Still, the bullish Ralliant narrative runs into two clear snags: weaker electric vehicle linked demand that already triggered a goodwill hit, and ongoing pressure in China that could cap segment earnings.
Find out about the key risks to this Ralliant narrative.
Another View: Ralliant Looks Expensive On Sales
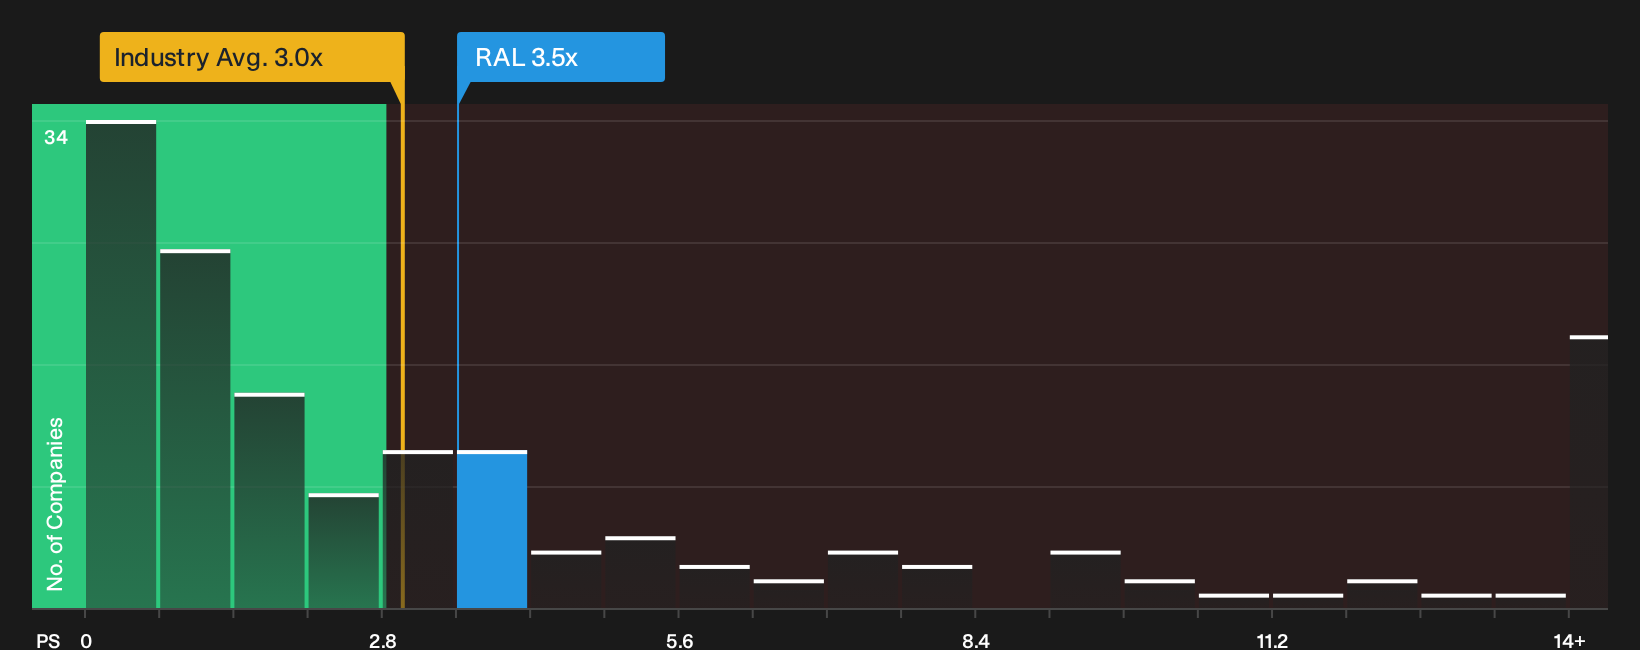
There is a different reading of Ralliant’s $69.17 share price when switching from fair value estimates to simple sales based pricing. On a P/S ratio of 3.5x, the stock trades above the US Electronic industry at 3x and also above its own fair ratio of 3.3x, which points to limited margin for error if the bullish earnings story slips.
For readers who lean on comparative pricing rather than detailed models, it can help to see how those headline ratios translate into valuation risk in practice. That is exactly what our breakdown of the numbers aims to unpack next, See what the numbers say about this price — find out in our valuation breakdown.
Next Steps
Mixed signals around Ralliant’s valuation story make this a good moment to check the underlying numbers yourself and decide where you stand. If you want a concise view of the upside case that has investors optimistic, start with the 1 key reward.
Looking for more investment ideas beyond Ralliant?
If Ralliant has you thinking more broadly about opportunities, use this moment to scan for other stocks that fit your risk, income, and quality preferences.
- Target resilient balance sheets by reviewing the list of solid balance sheet and fundamentals (25 results) that pair sturdy finances with underlying business strength.
- Hunt for potential mispricings by scanning the 31 high quality undervalued stocks that combine quality fundamentals with compressed expectations.
- Build a steadier income stream by checking out the 7 dividend fortresses that focus on higher yields backed by underlying cash flow support.
This article by Simply Wall St is general in nature. We provide commentary based on historical data and analyst forecasts only using an unbiased methodology and our articles are not intended to be financial advice. It does not constitute a recommendation to buy or sell any stock, and does not take account of your objectives, or your financial situation. We aim to bring you long-term focused analysis driven by fundamental data. Note that our analysis may not factor in the latest price-sensitive company announcements or qualitative material. Simply Wall St has no position in any stocks mentioned.
Have feedback on this article? Concerned about the content? Get in touch with us directly. Alternatively, email editorial-team@simplywallst.com