


Is Trinity Industries (TRN) Undervalued Following Its Latest Quarterly Results?
Trinity Industries (TRN) has been in focus after its latest quarterly report, where revenue topped expectations even as it declined year on year and both earnings per share and EBITDA fell short of estimates.
Trinity Industries’ share price has been under pressure in the wake of this earnings update, with the stock down 4.4% on the day, 11.4% over the past month and 25.2% across 90 days. Even so, the 3-year total shareholder return of 35.6% still leaves longer term holders in positive territory, suggesting near term momentum is fading while the longer run story remains more resilient.
Scan beyond Trinity Industries and compare this pullback with 31 high quality undervalued stocks.
After a 25% slide in 90 days but a still positive 3 year track record, Trinity Industries now sits at a crossroads. Do you treat this as an early entry, or wait for an even cheaper setup as the valuation case unfolds next?
Most Popular Narrative: 25% Undervalued
On the numbers, the most followed narrative sees Trinity Industries’ fair value at $34 per share, above the latest close at $25.54. That gap rests on a view that the business can work through softer forecasts while still justifying a higher valuation over time.
A structurally tight railcar market, coupled with elevated scrapping rates outpacing new builds, has led to a contracting railcar fleet. Eventual replacement demand and normalized delivery growth should boost order backlog, core segment revenues, and future earnings.
See why 2 investors see Trinity Industries as 25% undervalued.
Result: Fair Value of $34 (UNDERVALUED)
Still, Trinity Industries carries real execution risk if cyclical end markets weaken further, or if steel and maintenance costs continue to tighten already pressured margins.
Find out about the key risks to this Trinity Industries narrative.
Another View on Trinity Industries’ Valuation
The earlier fair value of $34 per Trinity Industries share leaned heavily on long term earnings forecasts and margin assumptions. A simple check against the SWS DCF model tells a different story, with the current price of $25.54 sitting above an estimated future cash flow value of $23.30, which points to a modest premium rather than a discount. That split leaves you weighing how much faith to place in long range earnings scenarios versus what the cash flow math implies today.
For readers who want to see how those cash flows are modeled step by step, have a look at the Look into how the SWS DCF model arrives at its fair value..
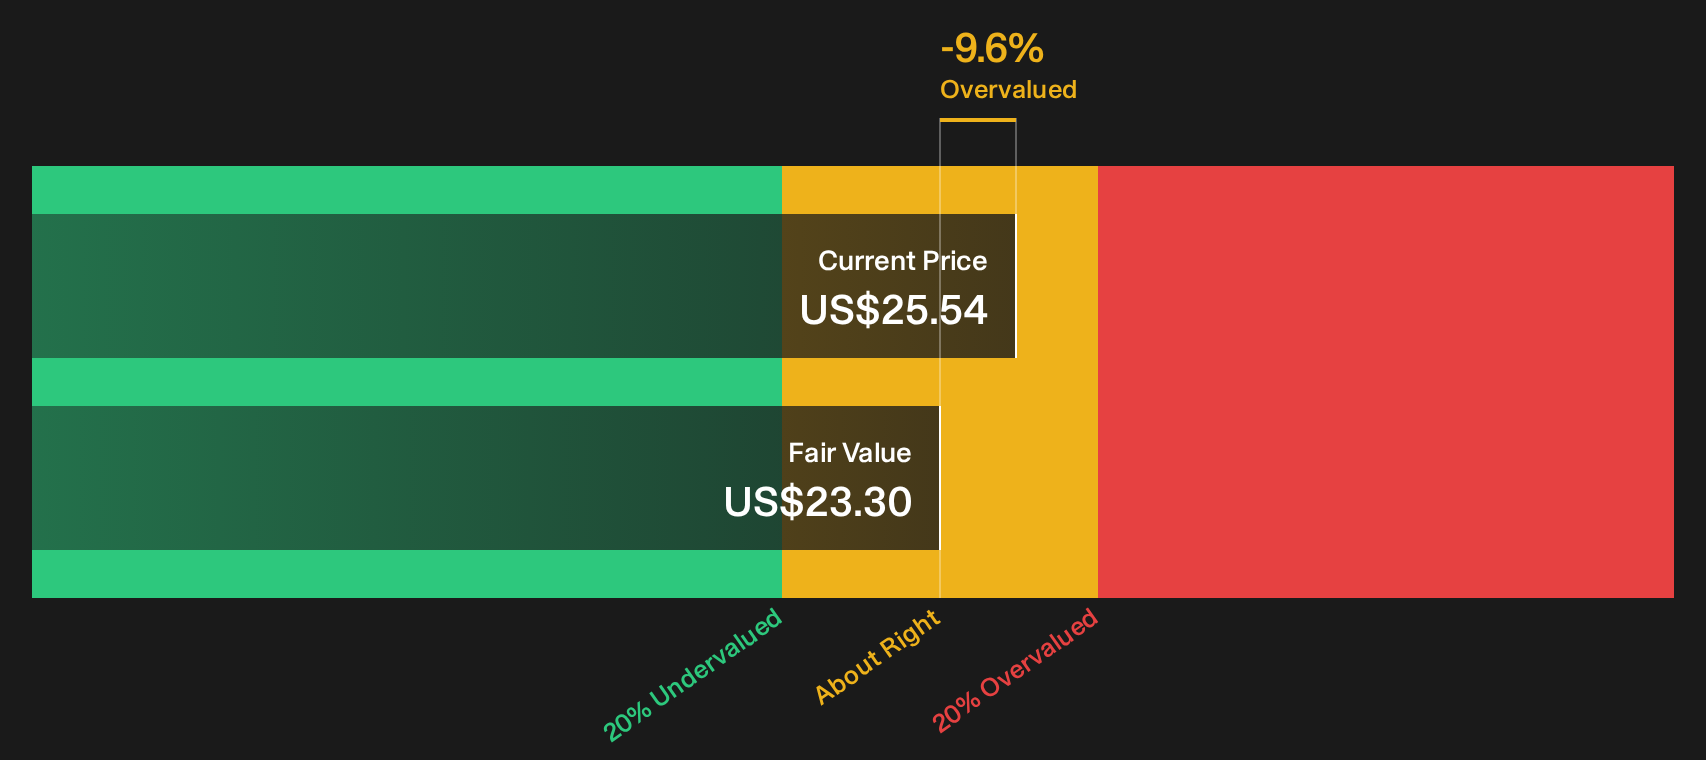
Simply Wall St performs a discounted cash flow (DCF) on every stock in the world every day (check out Trinity Industries for example). We show the entire calculation in full. You can track the result in your watchlist or portfolio and be alerted when this changes, or use our stock screener to discover 31 high quality undervalued stocks. If you save a screener we even alert you when new companies match - so you never miss a potential opportunity.
Next Steps
Sentiment on Trinity Industries is clearly mixed right now, with clear concerns but also some reasons for optimism. Consider your own risk tolerance and review the full picture of 2 key rewards and 5 important warning signs before making any decisions.
Looking for more investment ideas beyond Trinity Industries?
If Trinity Industries has you rethinking your watchlist, do not stop here. Use the Simply Wall St screener to uncover fresh opportunities that fit your style.
- Target high potential under-the-radar opportunities by scanning through 19 high quality undiscovered gems that combine strong fundamentals with room for the story to gain attention.
- Prioritise resilience first and filter for 31 resilient stocks with low risk scores so you can focus on businesses with steadier profiles when markets turn choppy.
- Zero in on reliable balance sheets by reviewing the list of solid balance sheet and fundamentals (25 results) and avoid missing companies that keep their finances tight.
This article by Simply Wall St is general in nature. We provide commentary based on historical data and analyst forecasts only using an unbiased methodology and our articles are not intended to be financial advice. It does not constitute a recommendation to buy or sell any stock, and does not take account of your objectives, or your financial situation. We aim to bring you long-term focused analysis driven by fundamental data. Note that our analysis may not factor in the latest price-sensitive company announcements or qualitative material. Simply Wall St has no position in any stocks mentioned.
Have feedback on this article? Concerned about the content? Get in touch with us directly. Alternatively, email editorial-team@simplywallst.com