


Stellantis (BIT:STLAM) Stock May Be Undervalued On French Plant Shutdowns
Stellantis has seen its share price fall sharply in recent years, which puts a fresh spotlight on whether the current market value still lines up with the sales the group generates. With the stock under pressure and investors watching every headline, the question is how much of Stellantis' revenue base is already reflected in today's price.
- Over the past 3 years the stock has declined 74.4%, which puts the focus squarely on whether the market is now giving too little or too much weight to Stellantis' sales profile.
- Production suspensions at four French plants in October due to a shortage of batteries for electric vehicles can affect near term output and may influence how investors think about the timing and reliability of future revenue from Stellantis' EV line up.
- Your read on Stellantis is one view; the desks covering it have another. See what analysts think Stellantis's shares could be worth.
The issue now is whether Stellantis' current share price is properly supported by the sales it generates today and the revenue investors expect in the coming years.
To put Stellantis in context and evaluate other ways to play this theme, compare it with companies in the 191 high quality undervalued stocks
Is Stellantis a Bargain on Sales?
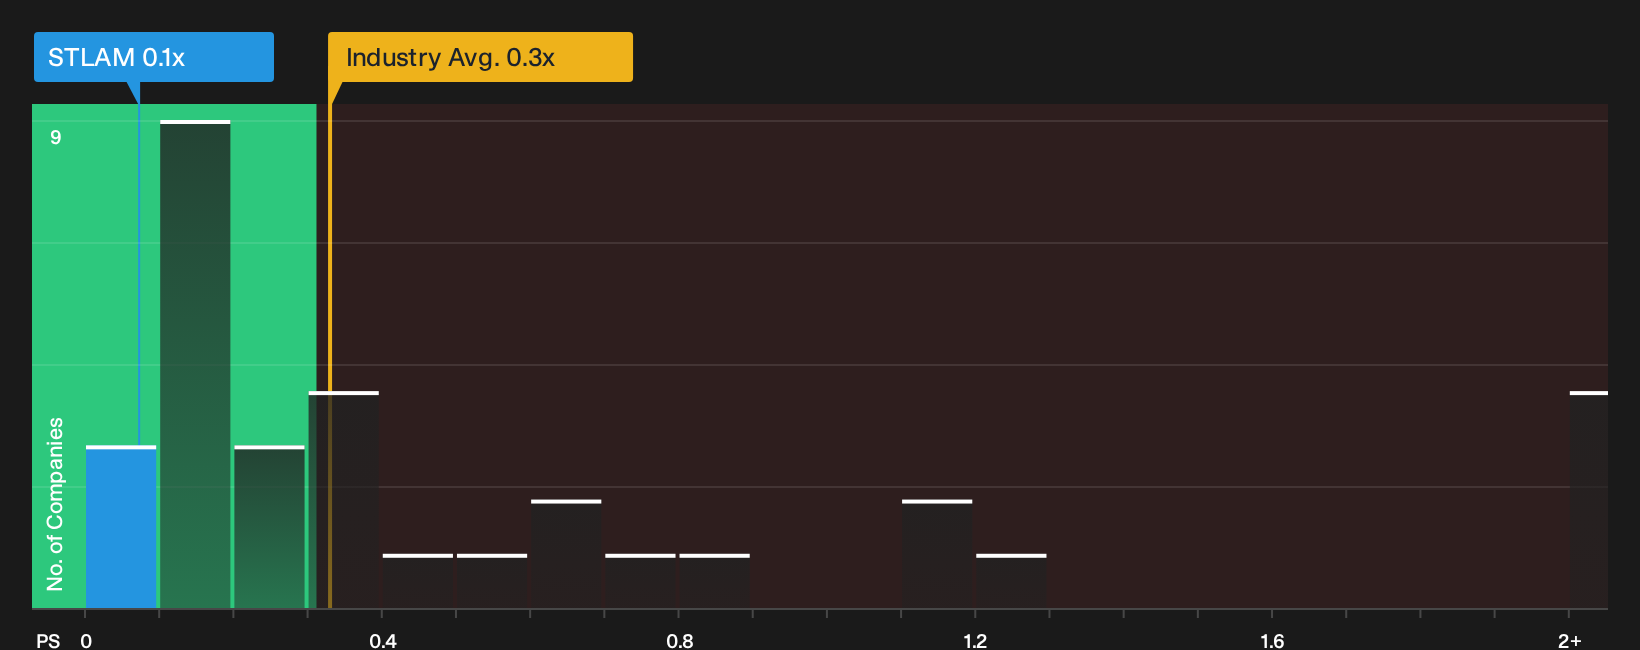
The P/S ratio suits Stellantis because the group is still judged heavily on the scale and resilience of its revenue rather than current earnings or book value. On this yardstick the picture is striking. Stellantis trades on a P/S of 0.1x, compared with an Auto sector average of about 0.6x and a peer cluster closer to 2.9x. That is a very low sales multiple for a large manufacturer with global brands.
Battery shortages that are set to pause production at several French plants in October may weigh on how reliable some investors see future EV revenue. Yet the current P/S still leaves Stellantis priced well below what the fair ratio model suggests for a business with its industry, margin profile and risk mix. For readers, the key judgment is whether that gap reflects temporary concerns about execution or a deeper worry about the quality and durability of its sales base. Explore the numbers behind Stellantis's P/S valuation.
The Stellantis Narrative: What Would Justify Today's Price?
Simply Wall St Narratives for Stellantis pick up where the valuation puzzle leaves off and explain which paths for growth, profitability and earnings would need to unfold for the shares to appear meaningfully higher or lower than today’s level. Each scenario links its headline number to a clear view on how Stellantis' revenue mix, margin profile and risk picture might change over time, giving you something concrete to revisit as new information is released.
One of the top community narratives on Stellantis: 58% undervalued
"So at $5.40, I am watching the operating numbers more than the asset values: North America, Europe, warranty, dealer inventory and Industrial free cash flow…"
Discover why this Narrative puts Stellantis at 58% undervalued.
One more thing about Stellantis that could change how you see the stock
There is one area of Stellantis that does not show up in simple price or sales ratios, where internal checks have highlighted issues that deserve a closer look from you. Take a closer look at 1 warning sign before settling on a valuation.
This article by Simply Wall St is general in nature. We provide commentary based on historical data and analyst forecasts only using an unbiased methodology and our articles are not intended to be financial advice. It does not constitute a recommendation to buy or sell any stock, and does not take account of your objectives, or your financial situation. We aim to bring you long-term focused analysis driven by fundamental data. Note that our analysis may not factor in the latest price-sensitive company announcements or qualitative material. Simply Wall St has no position in any stocks mentioned.
Have feedback on this article? Concerned about the content? Get in touch with us directly. Alternatively, email editorial-team@simplywallst.com