


Paz Retail And Energy (TASE:PAZ) Is Getting More Attention, What Is Behind It?
Paz Retail And Energy (TASE:PAZ) just picked up fresh attention after being added to the FTSE All-World Index, a global benchmark that many institutional investors track and mirror in their portfolios.
Recent trading has been steady rather than explosive, with the share price at ₪858.5 after a modest 4.01% 90 day share price return. However, Paz Retail And Energy’s 35.13% 1 year total shareholder return and very large 5 year total shareholder return of more than 4x hint at stronger, longer term momentum, while recent board refresh decisions and the FTSE All World inclusion keep attention firmly on the stock.
Scan other index-linked opportunities that are benefiting from similar institutional attention with our curated 190 high quality undervalued stocks, which combines earnings quality with balance sheet strength.
Paz Retail And Energy now carries fresh index-driven attention on top of years of strong shareholder returns. At ₪858.5, does the current valuation still leave enough upside potential to compensate you for the risks from here?
Preferred P/E Multiple Of 15.3x: Is It Justified For Paz Retail And Energy?
On simple earnings terms, Paz Retail And Energy trades on a P/E of 15.3x, which prices the stock above the Asian Oil and Gas industry average of 11.6x but slightly below the 15.9x average for its direct peer group.
The P/E ratio compares the current share price with earnings per share and effectively tells you how many years of current profit the market is willing to pay for. For a fuel retail and energy group with multiple revenue lines across transportation fuels, food retail, gas and renewables, and real estate, this metric helps you see how investors weigh current profitability relative to other listed operators.
That 15.3x earnings multiple sits at a premium to the broader Asian Oil and Gas sector. This suggests investors are willing to pay more for each shekel of Paz Retail And Energy’s profit than for the regional industry average. At the same time, the valuation is roughly in line with similar peers on 15.9x. This points to the market treating the firm as broadly in step with comparable stocks rather than attaching a steep discount or extreme premium.
Result: Price-to-earnings of 15.3x (ABOUT RIGHT)
See what the numbers say about this price — find out in our valuation breakdown.
Still, index-driven demand could reverse if Paz Retail And Energy drops out of key benchmarks. Any earnings miss against current expectations could quickly pressure that 15.3x P/E.
Find out about the key risks to this Paz Retail And Energy narrative.
Another View On Paz Retail And Energy’s Valuation
The earnings multiple looks roughly in line with peers, yet our DCF model paints a very different picture. At ₪858.5, Paz Retail And Energy trades at about a 51.6% discount to an estimated future cash flow value of ₪1,775.44. If that gap ever narrows, who benefits most: existing holders or new buyers?
Look into how the SWS DCF model arrives at its fair value.
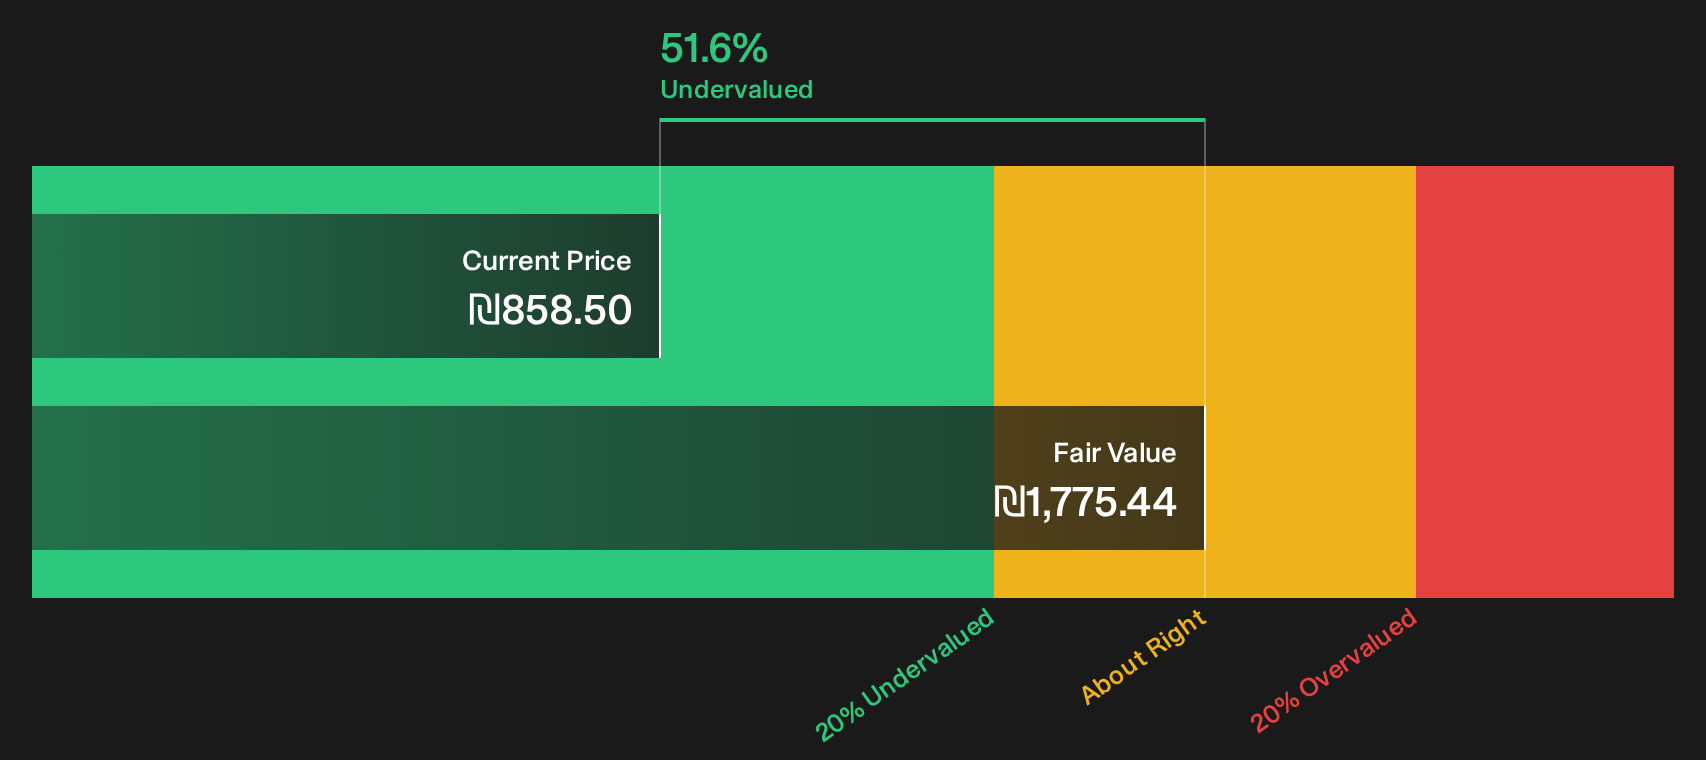
Simply Wall St performs a discounted cash flow (DCF) on every stock in the world every day (check out Paz Retail And Energy for example). We show the entire calculation in full. You can track the result in your watchlist or portfolio and be alerted when this changes, or use our stock screener to discover 190 high quality undervalued stocks. If you save a screener we even alert you when new companies match - so you never miss a potential opportunity.
Next Steps
There are mixed signals on Paz Retail And Energy so far. If you prefer to base your view on data rather than headlines, start with the full breakdown of 2 key rewards and 2 important warning signs.
Looking for more investment ideas beyond Paz Retail And Energy?
If you want a wider watchlist than just Paz Retail And Energy, the Simply Wall Street Screener can surface other opportunities that match your risk and return preferences.
Missing these could mean overlooking stocks that better fit your goals, so take a few minutes now to line up a richer set of options.
- Target consistent income by scanning for companies that aim to sustain sizeable payouts using the 158 dividend fortresses.
- Prioritise resilience by filtering for businesses with stronger finances and cleaner balance sheets through the list of solid balance sheet and fundamentals (205 results).
- Hunt for potential mispricings by using the 617 high quality undiscovered gems that pair quality fundamentals with relatively low market attention.
This article by Simply Wall St is general in nature. We provide commentary based on historical data and analyst forecasts only using an unbiased methodology and our articles are not intended to be financial advice. It does not constitute a recommendation to buy or sell any stock, and does not take account of your objectives, or your financial situation. We aim to bring you long-term focused analysis driven by fundamental data. Note that our analysis may not factor in the latest price-sensitive company announcements or qualitative material. Simply Wall St has no position in any stocks mentioned.
Have feedback on this article? Concerned about the content? Get in touch with us directly. Alternatively, email editorial-team@simplywallst.com