


Odakyu Electric Railway (TSE:9007) After August Traffic Update, Does The Valuation Still Look Pricey?
Odakyu Electric Railway (TSE:9007) has drawn fresh attention after reporting its preliminary August 2026 figures, with 59,008,000 passengers and commuter and non commuter revenue of ¥10,051 million, giving investors a timely read on current activity.
Set against that operational update, Odakyu Electric Railway’s share price has edged higher in recent months, with a 90 day share price return of 5.26% and a year to date gain of 3.63%. The 1 year total shareholder return of 6.90% contrasts with declines over the 3 and 5 year horizons, suggesting recent momentum is improving after a weaker longer term stretch.
Capture this surge of interest around Odakyu Electric Railway by comparing it with a curated 19 high quality undervalued stocks that combine solid cash flows with stronger balance sheets.Recent gains in Odakyu Electric Railway hint at investors reassessing the business after August’s passenger and revenue update, rather than simply reacting to a change in sentiment. So how does that optimism line up with today’s valuation numbers?
Preferred P/E of 17.4x: Is it justified?
On recent numbers, Odakyu Electric Railway trades on a P/E of 17.4x, which puts the share price at ¥1,782.5 against a mixed earnings track record and only modest forecasts.
The P/E ratio compares the current share price with earnings per share and gives you a quick sense of how much investors pay for each unit of profit. For a transportation and real estate group like Odakyu Electric Railway, this matters because earnings are tied to passenger volumes, property cycles, and lifestyle spending rather than fast scaling tech style growth.
There is tension in the figures. Analysts expect earnings to rise 9.67% per year and revenue to grow 5.4% per year. Both sit below the 20% threshold often associated with high growth, yet still edge ahead of the broader JP market earnings forecast of 9.1% per year. At the same time, return on equity is currently a low 6.9% and is projected to reach 9.5% in three years, so the market is paying a premium multiple while profitability metrics remain restrained.
The market is also assigning Odakyu Electric Railway a richer P/E than peers. The stock trades above the estimated fair P/E of 17.8x only marginally, so the fair ratio model points to a level the valuation could gravitate toward. Compared with the peer average of 11.9x and the wider JP Transportation industry on 12.3x, the current 17.4x looks clearly more expensive and implies investors are already baking in stronger earnings quality or resilience than the sector as a whole.
Explore the SWS fair ratio for Odakyu Electric Railway.
Result: Price-to-Earnings of 17.4x (OVERVALUED).
Still, Odakyu Electric Railway faces pressure from its weaker 3 and 5 year shareholder returns and relatively low current return on equity, which could limit enthusiasm.
Find out about the key risks to this Odakyu Electric Railway narrative.
Another view on Odakyu Electric Railway’s value
On the other side of the ledger, the SWS DCF model paints a very different picture for Odakyu Electric Railway. At a share price of ¥1,782.5 versus an estimated future cash flow value of ¥14.24, the stock looks very expensive on this metric. That gap raises a simple question for investors: Which signal feels more useful, earnings multiples or long term cash flows?
Look into how the SWS DCF model arrives at its fair value.
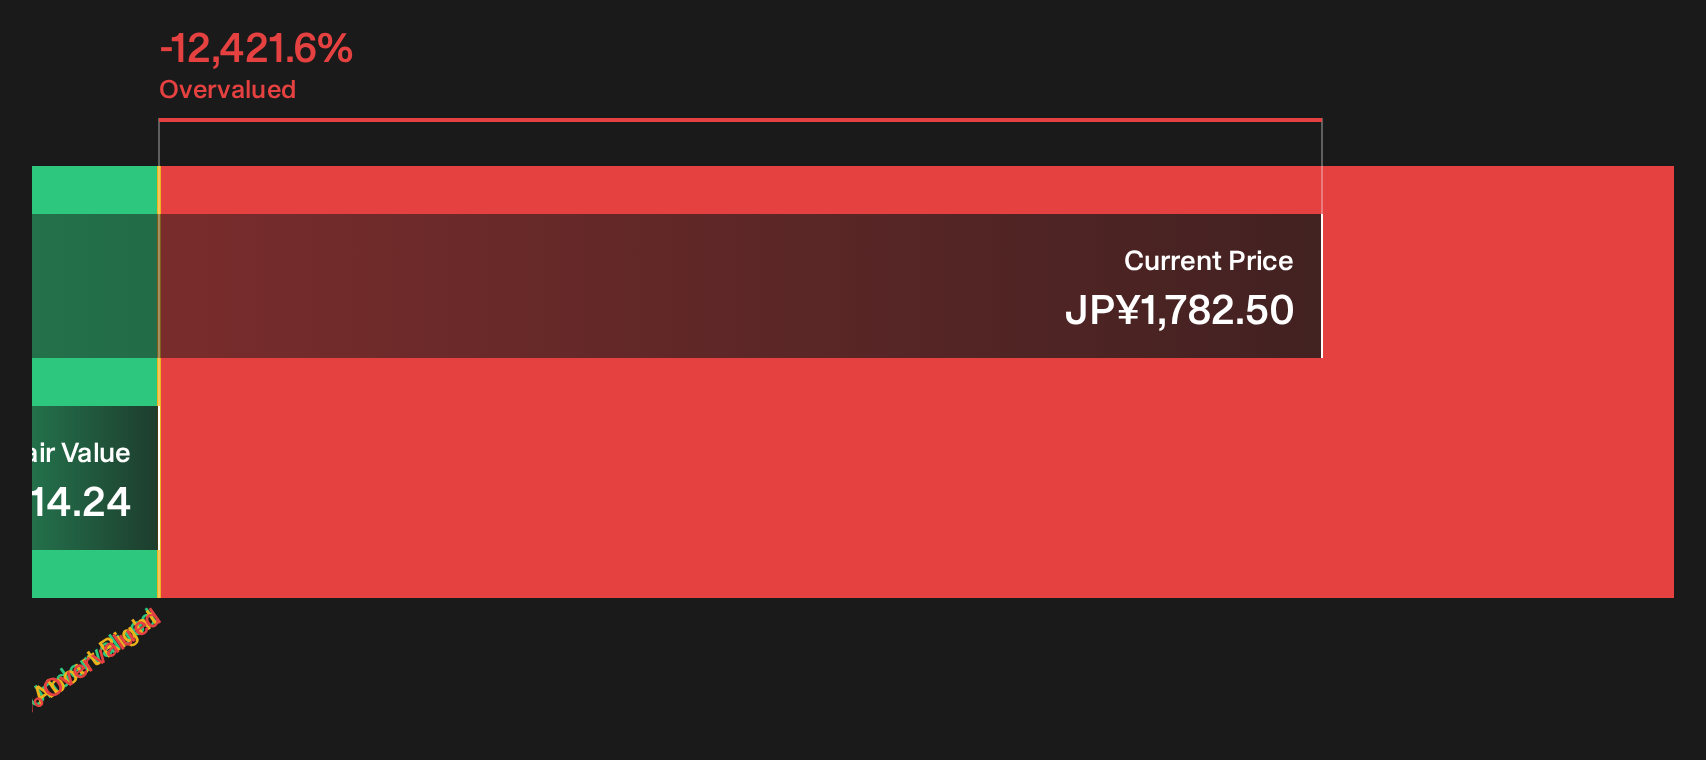
Simply Wall St performs a discounted cash flow (DCF) on every stock in the world every day (check out Odakyu Electric Railway for example). We show the entire calculation in full. You can track the result in your watchlist or portfolio and be alerted when this changes, or use our stock screener to discover 19 high quality undervalued stocks. If you save a screener we even alert you when new companies match - so you never miss a potential opportunity.
Next Steps
Curious whether the latest optimism around Odakyu Electric Railway really fits the mix of risks and potential upsides on the table? Act quickly, review the figures, and pressure test both sides of the story by digging into the 1 key reward and 2 important warning signs.
Hunting for more ideas beyond Odakyu Electric Railway?
Do not stop with Odakyu Electric Railway. Use the data you have, compare fresh opportunities, and let a focused stock search sharpen where you put your next yen.
- Target reliable compounding potential by using the 14 dividend fortresses that filters for income ideas with higher yields already on display.
- Sharpen your margin of safety by scanning the 74 high quality undiscovered gems that highlight quality companies many investors may still be overlooking.
- Reduce portfolio stress by reviewing the 21 resilient stocks with low risk scores aimed at businesses with sturdier financial profiles and lower risk scores.
This article by Simply Wall St is general in nature. We provide commentary based on historical data and analyst forecasts only using an unbiased methodology and our articles are not intended to be financial advice. It does not constitute a recommendation to buy or sell any stock, and does not take account of your objectives, or your financial situation. We aim to bring you long-term focused analysis driven by fundamental data. Note that our analysis may not factor in the latest price-sensitive company announcements or qualitative material. Simply Wall St has no position in any stocks mentioned.
Have feedback on this article? Concerned about the content? Get in touch with us directly. Alternatively, email editorial-team@simplywallst.com