


KOSE Holdings (TSE:4922) Left The FTSE All World Index, Is It 21% Below Fair Value?
KOSE Holdings (TSE:4922) was removed from the FTSE All-World Index (USD) on 19 September 2026, a shift that can influence institutional ownership patterns and may prompt investors to reassess liquidity and demand.
Recent trading in KOSE Holdings has been choppy, with a 13.77% 90-day share price return and a 7.99% year-to-date share price gain at a latest price of ¥5,716. At the same time, total shareholder return has declined 1.24% over the past year and is down more sharply over three and five years, which indicates fading long term momentum even as shorter term moves remain more supportive. The index exit on 19 September 2026 may have reinforced that tension between short term flows and longer term sentiment.
Compare KOSE Holdings' index exit with other businesses facing similar pressure by scanning our hand picked 19 high quality undervalued stocks, which may be seeing mispriced sentiment after recent index or sentiment shifts.
For KOSE Holdings, the index removal and mixed recent returns raise a sharper issue. Do current prices reflect the underlying cosmetics business, or are they being driven by short term sentiment swings related to forced selling and shifting demand?
Price-to-Earnings of 23.7x: Is it justified?
KOSE Holdings trades on a P/E of 23.7x at a last close of ¥5,716, which lines up with peers but sits above the wider Japanese personal products sector.
The P/E ratio compares the current share price to earnings per share and effectively tells you how many years of profit investors are willing to pay for. For a cosmetics group like KOSE Holdings, where brand strength and profit quality matter, that earnings multiple becomes a quick shortcut for how the market weighs current profitability against future expectations.
KOSE Holdings is assessed as good value against its estimated fair P/E of 25x. This suggests the current market multiple is below a level the valuation work points to. That same 23.7x figure matches the peer average, so the stock is not being priced at a clear premium or discount to similar companies. However, its P/E is described as expensive relative to the broader JP Personal Products industry average of 18.3x, where the sector trades on a meaningfully lower earnings multiple that the market could move towards.
Explore the SWS fair ratio for KOSE Holdings.
Result: Price-to-Earnings of 23.7x (ABOUT RIGHT)
Still, KOSE Holdings carries clear risks, including pressure from any prolonged weakness in long term shareholder returns and potential disruption if index related selling continues.
Find out about the key risks to this KOSE Holdings narrative.
Another View on KOSE Holdings: Cash Flows Paint a Different Picture
The P/E work suggests KOSE Holdings is roughly in line with peers, yet the SWS DCF model points to something different. At a recent price of ¥5,716, the stock sits about 20.6% below an estimated future cash flow value of ¥7,196.8. That gap raises a simple question: Are earnings multiples missing something that cash flows are picking up?
Look into how the SWS DCF model arrives at its fair value.
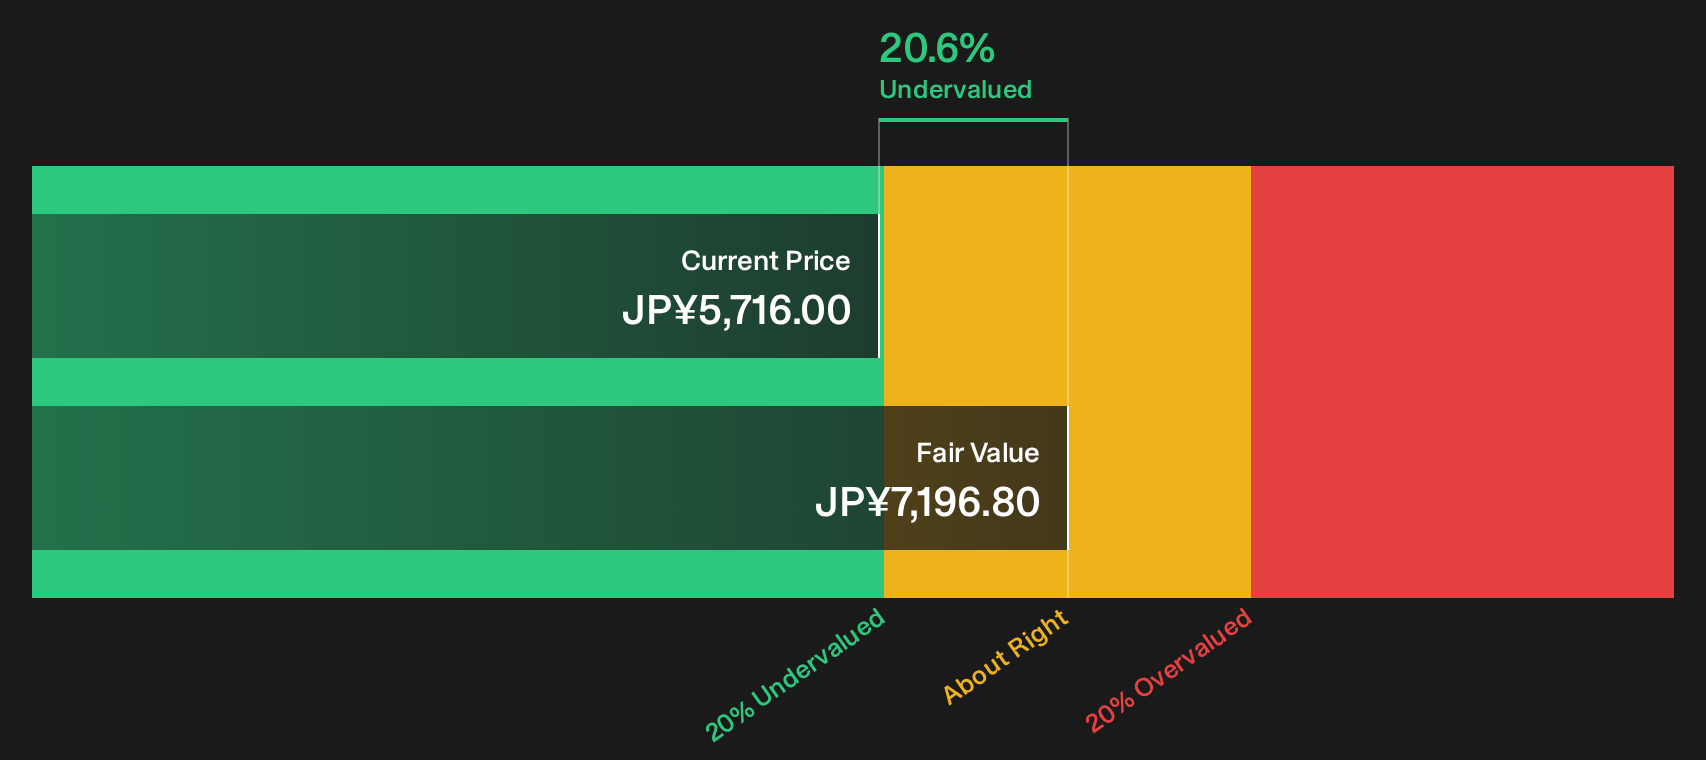
Simply Wall St performs a discounted cash flow (DCF) on every stock in the world every day (check out KOSE Holdings for example). We show the entire calculation in full. You can track the result in your watchlist or portfolio and be alerted when this changes, or use our stock screener to discover 19 high quality undervalued stocks. If you save a screener we even alert you when new companies match - so you never miss a potential opportunity.
Next Steps
Mixed signals around KOSE Holdings can be confusing, so move quickly, review the full data set, then weigh up the 3 key rewards and 1 important warning sign.
Looking for more KOSE Holdings style investment ideas?
If KOSE Holdings has sharpened your focus on valuation and quality, do not stop here. Broaden your watchlist with a few targeted stock ideas that match your approach.
- Target mispriced quality by scanning the 19 high quality undervalued stocks that combine strong fundamentals with potentially attractive entry points.
- Build steadier income potential by checking the 14 dividend fortresses that focus on higher yields with robust payout profiles.
- Strengthen your downside protection by filtering for companies in the 21 resilient stocks with low risk scores that score well on resilience and balance sheet strength.
This article by Simply Wall St is general in nature. We provide commentary based on historical data and analyst forecasts only using an unbiased methodology and our articles are not intended to be financial advice. It does not constitute a recommendation to buy or sell any stock, and does not take account of your objectives, or your financial situation. We aim to bring you long-term focused analysis driven by fundamental data. Note that our analysis may not factor in the latest price-sensitive company announcements or qualitative material. Simply Wall St has no position in any stocks mentioned.
Have feedback on this article? Concerned about the content? Get in touch with us directly. Alternatively, email editorial-team@simplywallst.com