


Learn Why The Bull Case For Russel Metals Stock Could Change Following Record Q2 Results
- Russel Metals reported record Q2 2026 revenues and shipments, supported by the integration of acquired Kloeckner service centers and a quarterly dividend of CA$0.44 per share.
- The combination of record operating performance and a dividend yield of about 2.08%, backed by strong liquidity and moderate leverage, highlights how Russel Metals is using its balance sheet to support shareholder returns through the cycle.
- We will assess how Russel Metals' record Q2 revenues and shipments reshape its existing investment narrative around growth, capital returns and risk.
Scan Russel Metals' latest record quarter alongside a curated list of income-focused industrials available through 1 dividend fortresses that may offer similar balance sheet support for regular payouts.
Russel Metals Investment Narrative Recap
To own Russel Metals, you need to be comfortable with a metals distributor that leans into cyclicality but backs it with a solid balance sheet and consistent cash returns. The record Q2 2026 revenues and shipments reinforce that the operating engine is working, with Kloeckner integration feeding volume and processing capability rather than creating drag.
The key short term swing factor is still volume and pricing in core steel and energy markets, especially as any prior inventory lag benefits fade. That risk has not gone away. Record activity does not materially change exposure to weaker construction or manufacturing demand, or to tariff and trade policy shifts that can whipsaw margins.
The most relevant development here is the higher quarterly dividend, now at CA$0.44 per share, which sits on top of the record Q2 performance. Russel Metals pairs that payout with a yield of about 2.08%, supported by what management describes as strong earnings coverage, ample liquidity, and moderate leverage.
For you, the link between the dividend and the latest quarter is all about proof of cash generation through a cycle that still carries obvious risks. The distribution policy now needs to be tested against potential margin compression, acquisition integration work, and any cooling in infrastructure or energy related demand that could pressure future free cash flow.
Russel Metals is framed by analysts around a 10.4% yearly top line expansion, with revenues projected to reach CA$6.6b and earnings expected at CA$257.9m by 2029, compared with earnings today of CA$197.6m. This implies an earnings increase of about CA$60m over that period.
Uncover why Russel Metals' fair value indicates a 28% potential downside to its current price, which leaves little room for error.
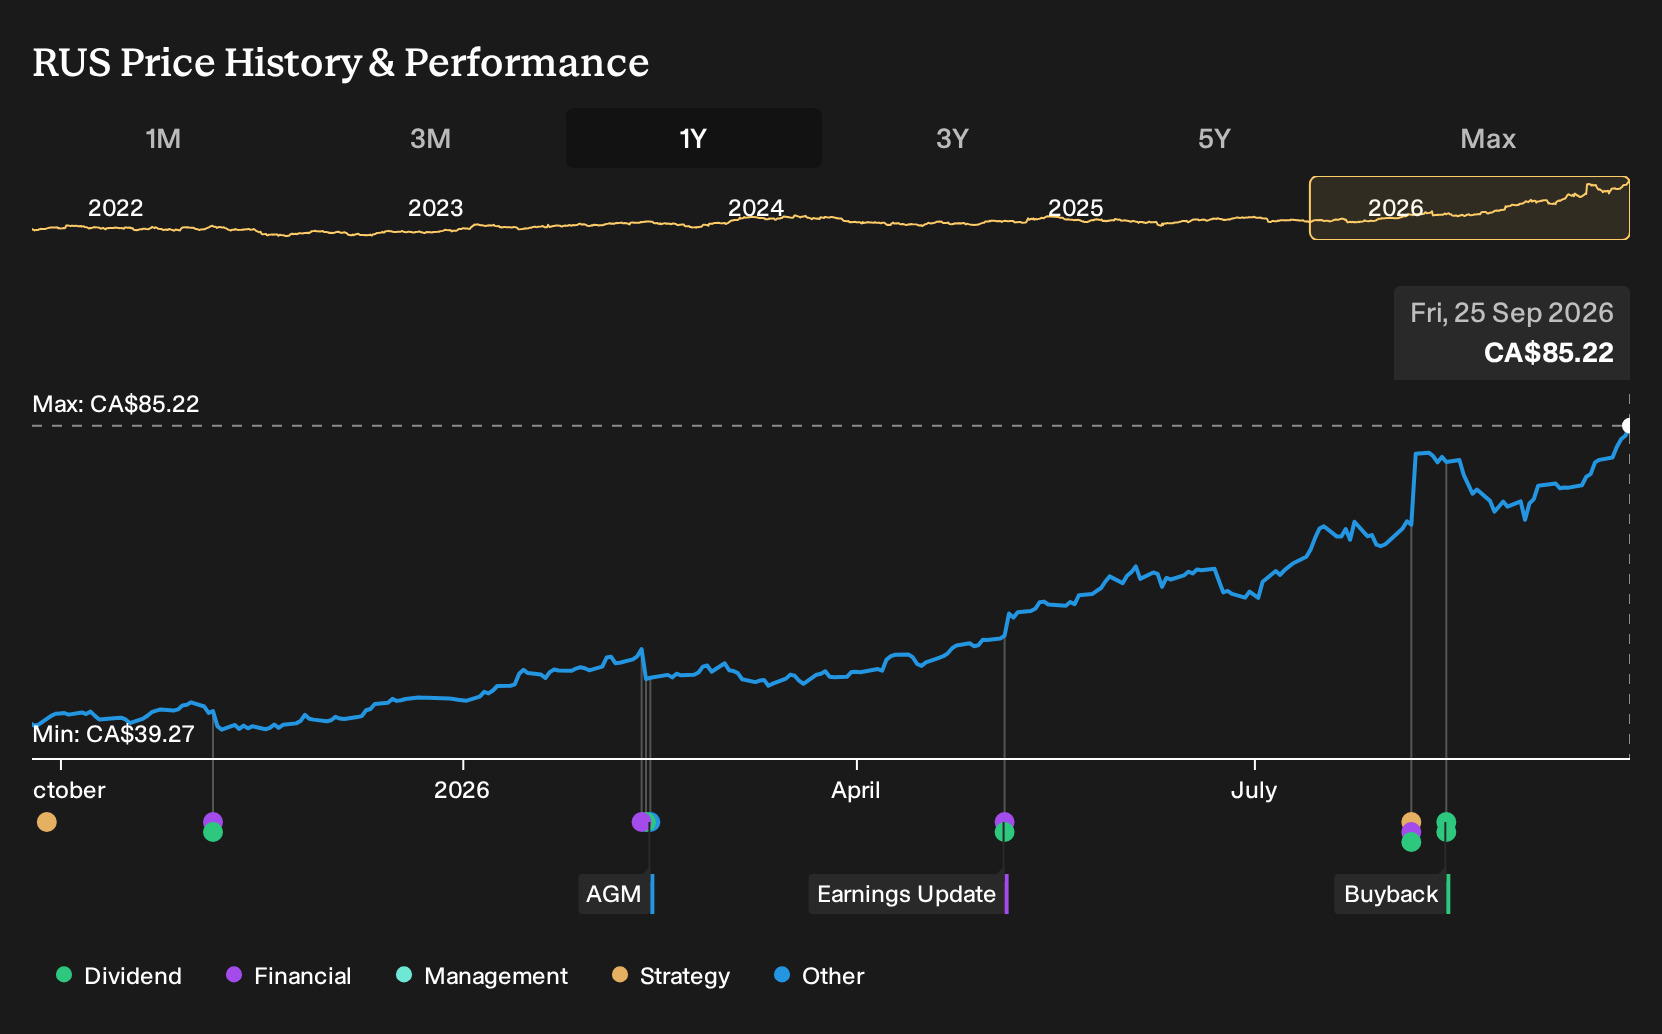
Exploring Other Perspectives
Two fair value estimates from the Simply Wall St Community cluster in a narrow CA$61.5 to CA$77 band, so you see tight yet varied expectations for Russel Metals. When you set that against clear risks around tariffs, end market cyclicality, and acquisition reliance, it becomes clear that opinion can diverge sharply. Explore the other viewpoints.
Explore another Russel Metals fair value estimate, including one that suggests it could be worth as much as CA$76.97.
The Verdict Is Yours
Don't just follow the ticker; dig into the data and build a conviction that's truly your own.
- A great starting point for your Russel Metals research is our analysis highlighting 3 key rewards and 2 important warning signs that could impact your investment decision.
- See our latest analysis for Russel Metals. The report includes a comprehensive fundamental analysis summarized in a single visual, the Snowflake, making it easy to evaluate Russel Metals' overall financial health at a glance.
Looking for more Russel Metals style ideas?
If Russel Metals fits your income and balance sheet preferences, it can help to widen the lens and compare it with other businesses that share similar traits but sit in different parts of the market.
- For investors who want potential bargains backed by quality fundamentals, scan the 5 high quality undervalued stocks that filter for businesses combining attractive pricing with financial strength.
- If resilience matters most to you, focus on 8 resilient stocks with low risk scores that highlight companies with steadier risk profiles and more defensive characteristics.
- When you want dependable finances to underpin any dividend story, narrow in on the list of solid balance sheet and fundamentals (7 results) so you can compare payout profiles against robust balance sheets.
This article by Simply Wall St is general in nature. We provide commentary based on historical data and analyst forecasts only using an unbiased methodology and our articles are not intended to be financial advice. It does not constitute a recommendation to buy or sell any stock, and does not take account of your objectives, or your financial situation. We aim to bring you long-term focused analysis driven by fundamental data. Note that our analysis may not factor in the latest price-sensitive company announcements or qualitative material. Simply Wall St has no position in any stocks mentioned.
Have feedback on this article? Concerned about the content? Get in touch with us directly. Alternatively, email editorial-team@simplywallst.com