


Why Dentsu Soken (TSE:4812) Is Back In The Spotlight
Dentsu Soken (TSE:4812) has drawn fresh attention after its recent name change from Information Services International Dentsu. The shift puts focus on how this ¥558.2b IT group earns and values its business.
Over the past few months, Dentsu Soken’s share price has climbed, with a 30-day share price return of 4.42% and a 90-day share price return of 41.79%. The 1-year total shareholder return of 32.14% points to momentum that has been building rather than fading.
Compare that momentum in Dentsu Soken with other IT and software players breaking higher by scanning the hand picked 19 high quality undervalued stocks for potential ideas in the same space.
Dentsu Soken now looks like a sizeable, growing IT specialist with clear segment breadth, yet the share price has already moved sharply. Is that recent run fully justified by what investors are paying today?
Price-to-Earnings of 31.8x for Dentsu Soken: Is it justified?
Dentsu Soken now trades on a P/E of 31.8x, which is a rich tag when set against both its IT peers and the broader JP IT sector average.
The P/E ratio compares the share price with earnings per share and effectively shows how many years of current profit investors are willing to pay for. For an IT solutions group like Dentsu Soken, that figure often reflects how much faith the market has in its ability to keep growing earnings in areas such as Manufacturing Solutions, Financial Solutions, Business Solutions and Communication IT.
Here, the market appears to be paying up for consistency. Earnings have risen 13.4% per year over the past 5 years, grew 13% over the past year, and are forecast to expand 13.7% per year, which is faster than both the JP market’s 9.1% earnings forecast and the 6.5% revenue growth expected for Japan overall. Against that profile, analysts see a future return on equity of 18% and the SWS DCF model indicates a future cash flow value of ¥2,025.04 per share compared with the current ¥2,860, so the market is clearly assigning a premium that runs ahead of that cash flow estimate.
The premium becomes starker when you compare Dentsu Soken with its reference points. Its 31.8x P/E is much higher than the peer average of 18.1x and also well above the JP IT industry average of 16.4x. It also trades well ahead of the estimated fair P/E of 25.9x. This is a level the market could move towards if sentiment cools or if growth fails to keep matching expectations.
Explore the SWS fair ratio for Dentsu Soken.
Result: Price-to-Earnings of 31.8x (OVERVALUED)
Still, the premium around Dentsu Soken could unwind quickly if IT budgets in Japan tighten, or if its segment mix shifts away from higher margin work.
Find out about the key risks to this Dentsu Soken narrative.
Another View on Dentsu Soken’s Value
The SWS DCF model points to a future cash flow value of ¥2,025.04 per share for Dentsu Soken, which sits below the current ¥2,860 price. On this measure the stock screens as overvalued. It raises a straightforward question for you: Is the recent share price strength running ahead of fundamentals?
Look into how the SWS DCF model arrives at its fair value.
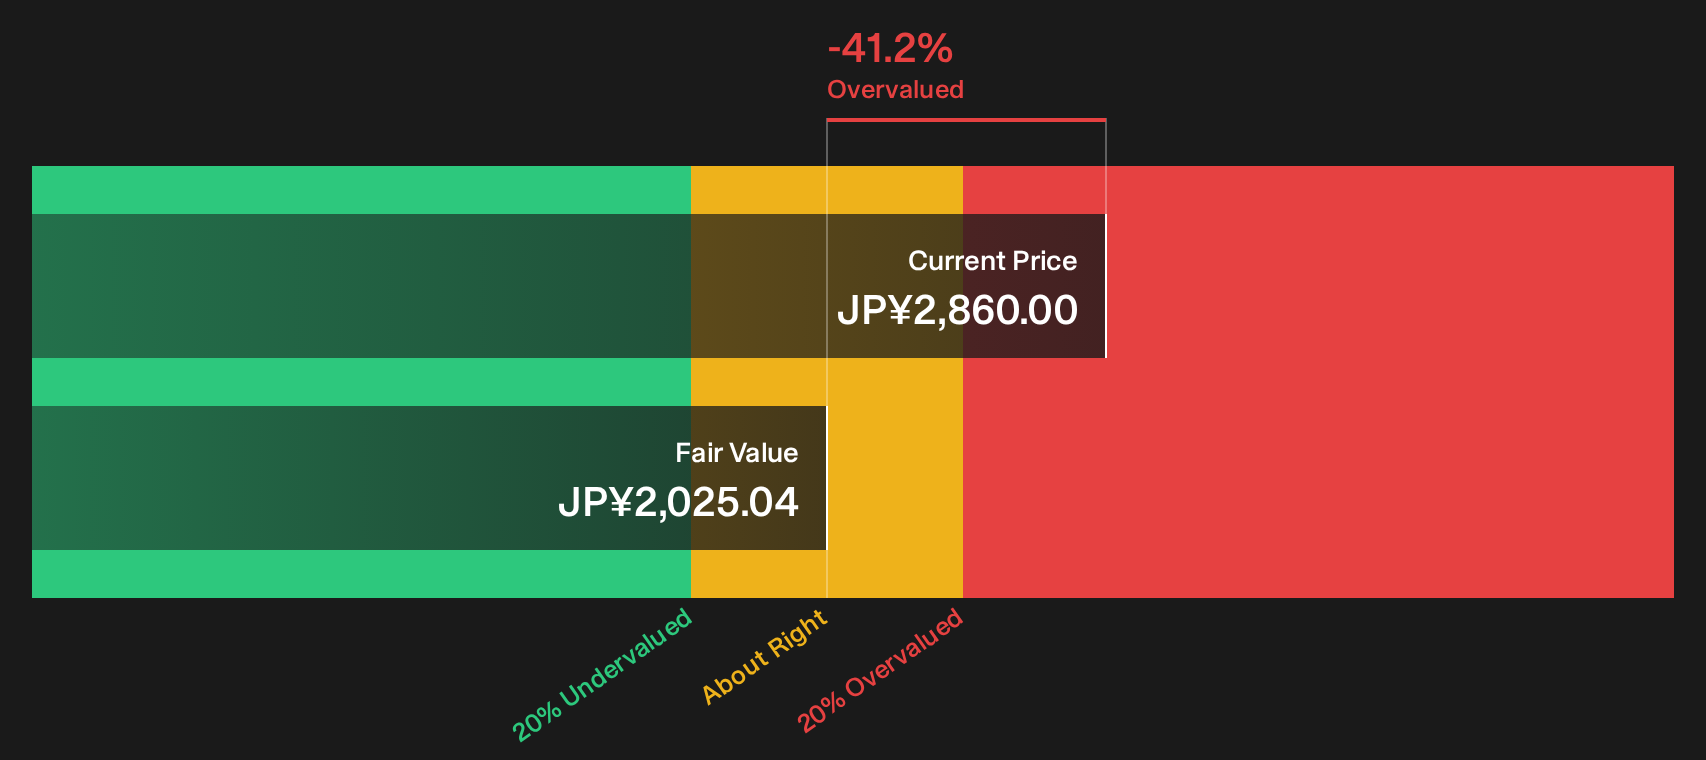
Simply Wall St performs a discounted cash flow (DCF) on every stock in the world every day (check out Dentsu Soken for example). We show the entire calculation in full. You can track the result in your watchlist or portfolio and be alerted when this changes, or use our stock screener to discover 19 high quality undervalued stocks. If you save a screener we even alert you when new companies match - so you never miss a potential opportunity.
Next Steps
If this mix of optimism and concern around Dentsu Soken leaves you undecided, take the time to review the full picture and weigh both sides of the story by checking the 2 key rewards and 1 important warning sign
Want more investment ideas beyond Dentsu Soken?
If Dentsu Soken has you thinking more broadly about where to put fresh capital, use this momentum to widen your watchlist with targeted, data driven ideas.
- Chase potential mispricing by scanning the 19 high quality undervalued stocks that combine solid fundamentals with compelling valuation signals.
- Build a steadier income stream by reviewing the 14 dividend fortresses that focus on higher yielding yet resilient payers.
- Protect your downside by filtering for the 21 resilient stocks with low risk scores that score well on balance sheet strength and risk metrics.
This article by Simply Wall St is general in nature. We provide commentary based on historical data and analyst forecasts only using an unbiased methodology and our articles are not intended to be financial advice. It does not constitute a recommendation to buy or sell any stock, and does not take account of your objectives, or your financial situation. We aim to bring you long-term focused analysis driven by fundamental data. Note that our analysis may not factor in the latest price-sensitive company announcements or qualitative material. Simply Wall St has no position in any stocks mentioned.
Have feedback on this article? Concerned about the content? Get in touch with us directly. Alternatively, email editorial-team@simplywallst.com