


Why Ubiquiti (UI) Is Getting Attention Today
Fresh analyst commentary around Ubiquiti (UI) has focused on three key points: projected earnings per share growth above sector averages, strong asset utilization, and recent upward revisions to earnings estimates that have contributed to more positive sentiment.
At a share price of US$589.48, Ubiquiti has posted a 7 day share price return of 4.49% and a 30 day share price return of 5.45%. However, the 1 year total shareholder return is down 6.75%, while the 3 year total shareholder return is up more than 3x. This suggests that shorter term momentum has picked up within a much larger multiyear upswing in investor outcomes.
Scan how Ubiquiti’s recent momentum compares with other potential breakout candidates on our curated list of 16 high quality undiscovered gems for investors hunting strong fundamentals that the market may be underpricing.
Ubiquiti’s share price has sprinted ahead while analyst targets and intrinsic value models still point higher, creating a wide valuation spread. So where does fair value actually land within that gap?
Price-to-Earnings of 37.2x: Is it justified?
Ubiquiti’s P/E ratio of 37.2x sits above several key benchmarks, which signals that buyers are paying a premium at the current $589.48 share price.
The P/E ratio compares what investors pay today to each dollar of current earnings. For a hardware and networking specialist like Ubiquiti, that figure often reflects expectations around earnings durability, cash generation, and the potential for future profit expansion rather than just next quarter’s results.
Recent data points give that premium some context. Earnings grew 34.9% over the past year compared with a 14.7% per year pace over five years, and profit margins improved from 27.7% to 29.3%. Forecasts also point to earnings growth of 19.57% per year and revenue growth of 16.5% per year, both ahead of the broader US market but below the 20% threshold often labeled as very high growth. That pattern suggests buyers are paying up for a strong earnings profile and high quality results rather than extreme growth projections.
The comparison with peers is mixed but leans expensive. Ubiquiti trades on a higher P/E than the US Communications industry average of 34.4x, so the stock is priced more richly than the sector. At the same time, its 37.2x multiple sits well below the 51.8x peer average referenced in the fair ratio assessment. This indicates that part of the valuation premium has already been tempered relative to closer comparables and could shift further if the market moves closer to that estimated fair level.
Explore the SWS fair ratio for Ubiquiti.
Result: Price-to-Earnings of 37.2x (OVERVALUED).
Still, Ubiquiti’s rich 37.2x P/E, combined with any shift in demand for its networking platforms across key regions, could quickly compress that valuation gap.
Find out about the key risks to this Ubiquiti narrative.
Another view on Ubiquiti’s valuation
One model says Ubiquiti is priced rich. The SWS DCF model goes further and values the stock at $486.24 per share, which is below the current $589.48 level and indicates an overvalued outcome based on projected cash flows.
That creates a clear clash between earnings-driven multiples and cash flow-based fair value. The question is which lens should carry more weight in your process.
Look into how the SWS DCF model arrives at its fair value.
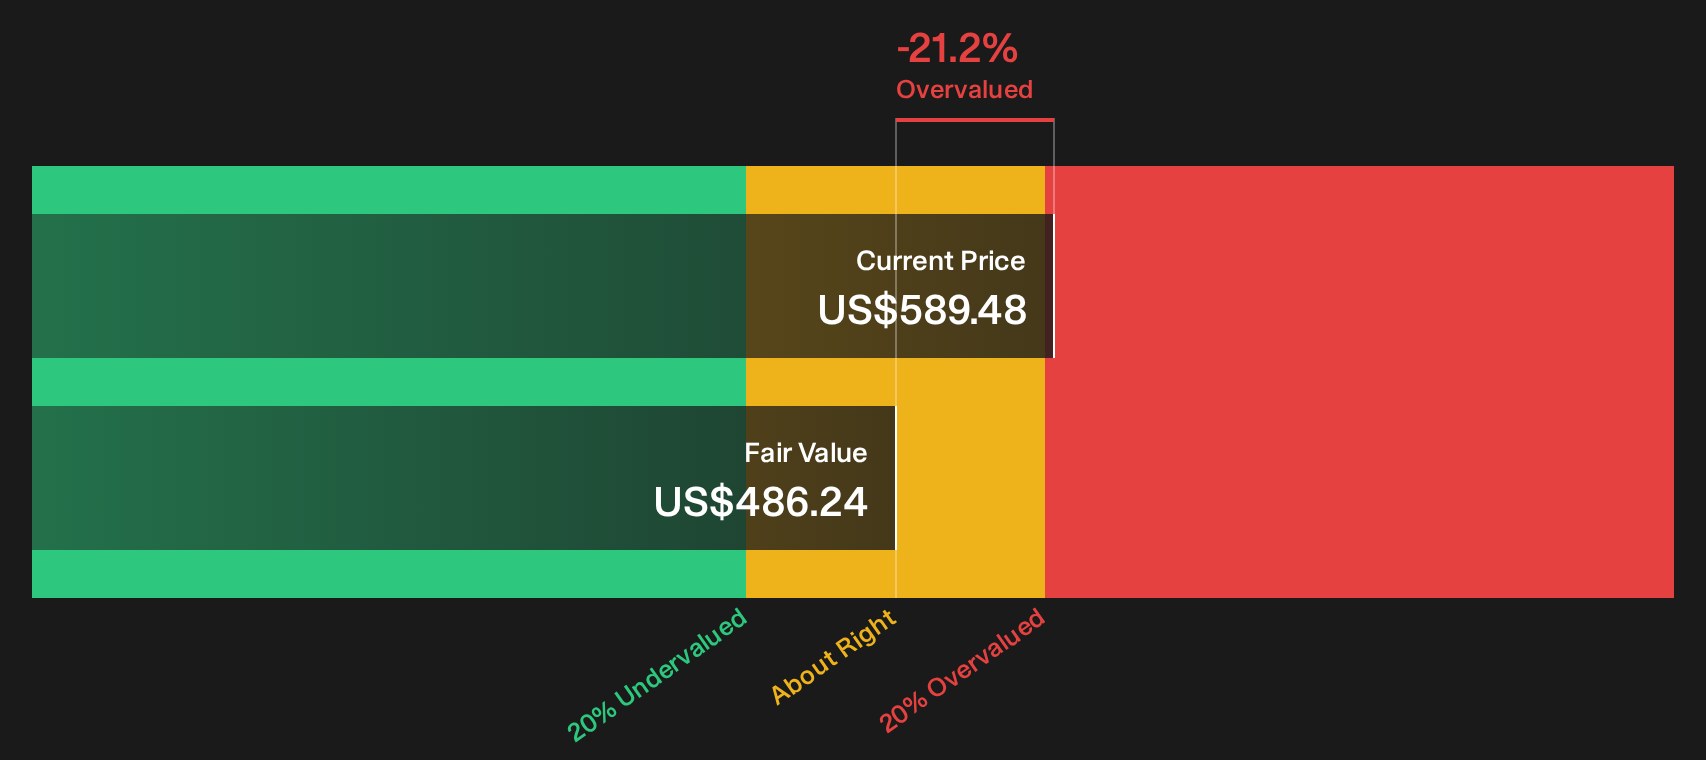
Simply Wall St performs a discounted cash flow (DCF) on every stock in the world every day (check out Ubiquiti for example). We show the entire calculation in full. You can track the result in your watchlist or portfolio and be alerted when this changes, or use our stock screener to discover 35 high quality undervalued stocks. If you save a screener we even alert you when new companies match - so you never miss a potential opportunity.
Next Steps
Momentum, risk and conflicting valuation models paint a complicated picture. Move quickly, review the underlying data, and size up Ubiquiti on your own terms with 2 key rewards
Want more ideas beyond Ubiquiti?
Do not stop your research with Ubiquiti. Broader context around quality, value and risk across other companies can sharpen your decisions and reveal opportunities you might otherwise skip.
- Target potential mispricing by reviewing a curated 35 high quality undervalued stocks that couples strong fundamentals with valuations the market may not be fully recognizing.
- Lock in income-focused opportunities by scanning a focused 7 dividend fortresses designed for investors who care about yield and staying power.
- Prioritize resilience by combing through a 30 resilient stocks with low risk scores filter that emphasizes sturdier balance sheets and cleaner risk profiles.
This article by Simply Wall St is general in nature. We provide commentary based on historical data and analyst forecasts only using an unbiased methodology and our articles are not intended to be financial advice. It does not constitute a recommendation to buy or sell any stock, and does not take account of your objectives, or your financial situation. We aim to bring you long-term focused analysis driven by fundamental data. Note that our analysis may not factor in the latest price-sensitive company announcements or qualitative material. Simply Wall St has no position in any stocks mentioned.
Have feedback on this article? Concerned about the content? Get in touch with us directly. Alternatively, email editorial-team@simplywallst.com