


Is Aflac (AFL) Fairly Valued After Its Shares Closed Near $117?
Aflac (AFL) drew fresh attention after its shares closed at US$117.55, with the insurer posting annual revenue of US$18.1b and net income of US$4.9b across its Japan and U.S. segments.
Recent trading paints a mixed picture for Aflac. The share price is up 2.1% over the past week and has a 6.6% year-to-date share price return. However, it is down 3.2% over the last month, while total shareholder return of 11.5% over one year and 156.3% over five years hints that long term holders have been rewarded even as short term momentum looks more muted.
Scan Aflac's recent move against peers and see which insurers and financials currently meet tight balance-sheet and return filters with the hand picked 11 resilient stocks with low risk scores list.
Short term traders see Aflac pause after a solid multi year run. Long term holders see a business on US$18.1b of revenue and US$4.9b of profit. Which side is getting the better entry right now?
Most Popular Narrative: 0% Undervalued
Aflac's most followed valuation story pegs fair value at $117.71, almost on top of the recent $117.55 close, so every assumption matters.
Increased adoption of digital underwriting, customer-facing Gen AI, and digital human avatar initiatives in both Japan and the U.S. is expected to lower long-term operational costs and improve customer engagement, with the potential to materially expand net margins through enhanced efficiency and better scalability.
See why 37 investors see Aflac as 0% undervalued.
Result: Fair Value of $117.71 (ABOUT RIGHT)
Still, pressure on Japan premiums and higher technology expenses could restrain Aflac's earnings progress and keep the fair value narrative tightly constrained.
Find out about the key risks to this Aflac narrative.
Another View: Aflac On Earnings Multiples
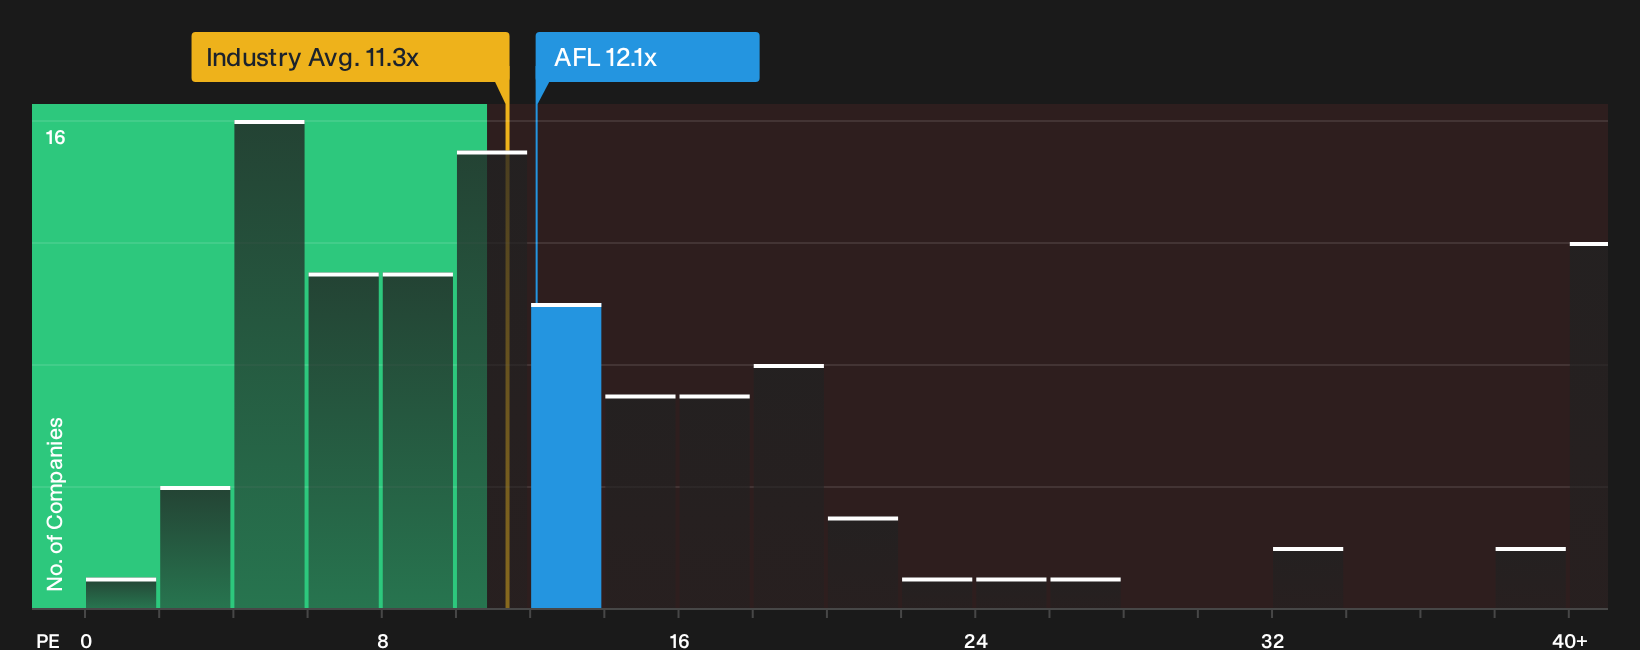
Aflac looks inexpensive relative to peers on one metric yet richer on another. The stock trades on a P/E of 12.1x versus a 16.7x peer average, which points to a discount. At the same time, that 12.1x sits above both the US Insurance industry at 11.3x and a fair ratio of 9.7x, which hints at less room for error if earnings weaken. Which reference point do you trust most when the future path of profits is this contested?
For a closer look at how these valuation checks stack up across different price ratios, See what the numbers say about this price — find out in our valuation breakdown.
Next Steps
Mixed signals around Aflac's valuation and earnings expectations can pull you in either direction, so move quickly, test the assumptions yourself, and weigh both sides of the story using the 3 key rewards and 1 important warning sign.
Looking for more ideas beyond Aflac?
You do not need to stop with Aflac. Use the screener to spot fresh candidates that fit your style before the crowd starts paying attention.
- Target potential upside by scanning a focused set of quality opportunities using the 16 high quality undiscovered gems.
- Strengthen your income stream by zeroing in on companies that offer resilient payouts with the 6 dividend fortresses.
- Protect your downside first and hunt for resilient businesses with the 11 resilient stocks with low risk scores.
This article by Simply Wall St is general in nature. We provide commentary based on historical data and analyst forecasts only using an unbiased methodology and our articles are not intended to be financial advice. It does not constitute a recommendation to buy or sell any stock, and does not take account of your objectives, or your financial situation. We aim to bring you long-term focused analysis driven by fundamental data. Note that our analysis may not factor in the latest price-sensitive company announcements or qualitative material. Simply Wall St has no position in any stocks mentioned.
Have feedback on this article? Concerned about the content? Get in touch with us directly. Alternatively, email editorial-team@simplywallst.com