


How Bold Was Cotton's Move?
December cotton got a lot of press this past spring and summer as the contract posted a strong rally.
The move was driven by strong buying from noncommercial traders, while the commercial side used the rally to sell.
Seasonally, the Dec26 issue did what it tends to do, and now we'll see if it the seasonal patterns continue to hold.
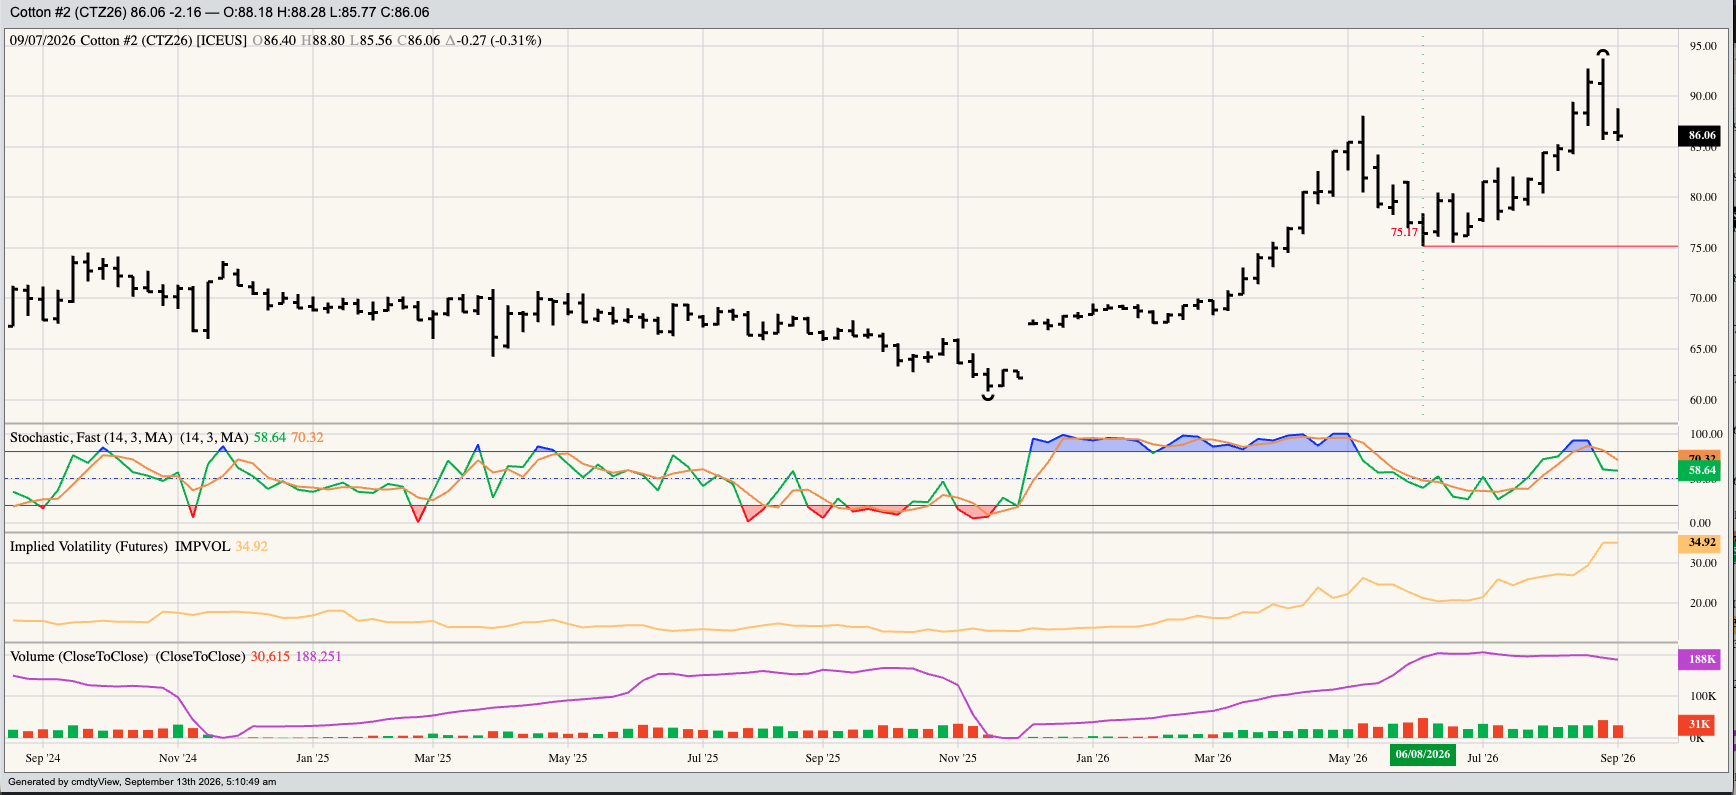
It seemed wherever we looked this past summer, someone was writing about the cotton market. Granted, the new-crop December issue (CTZ26) was dazzling as it rallied from a low of 75.17 (cents per pound) the week of June 8 to a high of 93.74 the week of August 31. This was a gain of 18.57, or nearly 25% for those on the investment side of the market, certainly an extraordinary, bold move. Right? Well, maybe not as much as we were told as the summer unfolded.
Let’s take a look at the structure of the market. (Recall commodity markets have two sides: Noncommercial and commercial. The noncommercial side sets the trend of the futures market, generally, while the commercial side shows us real supply and demand with the trend of futures spreads.)
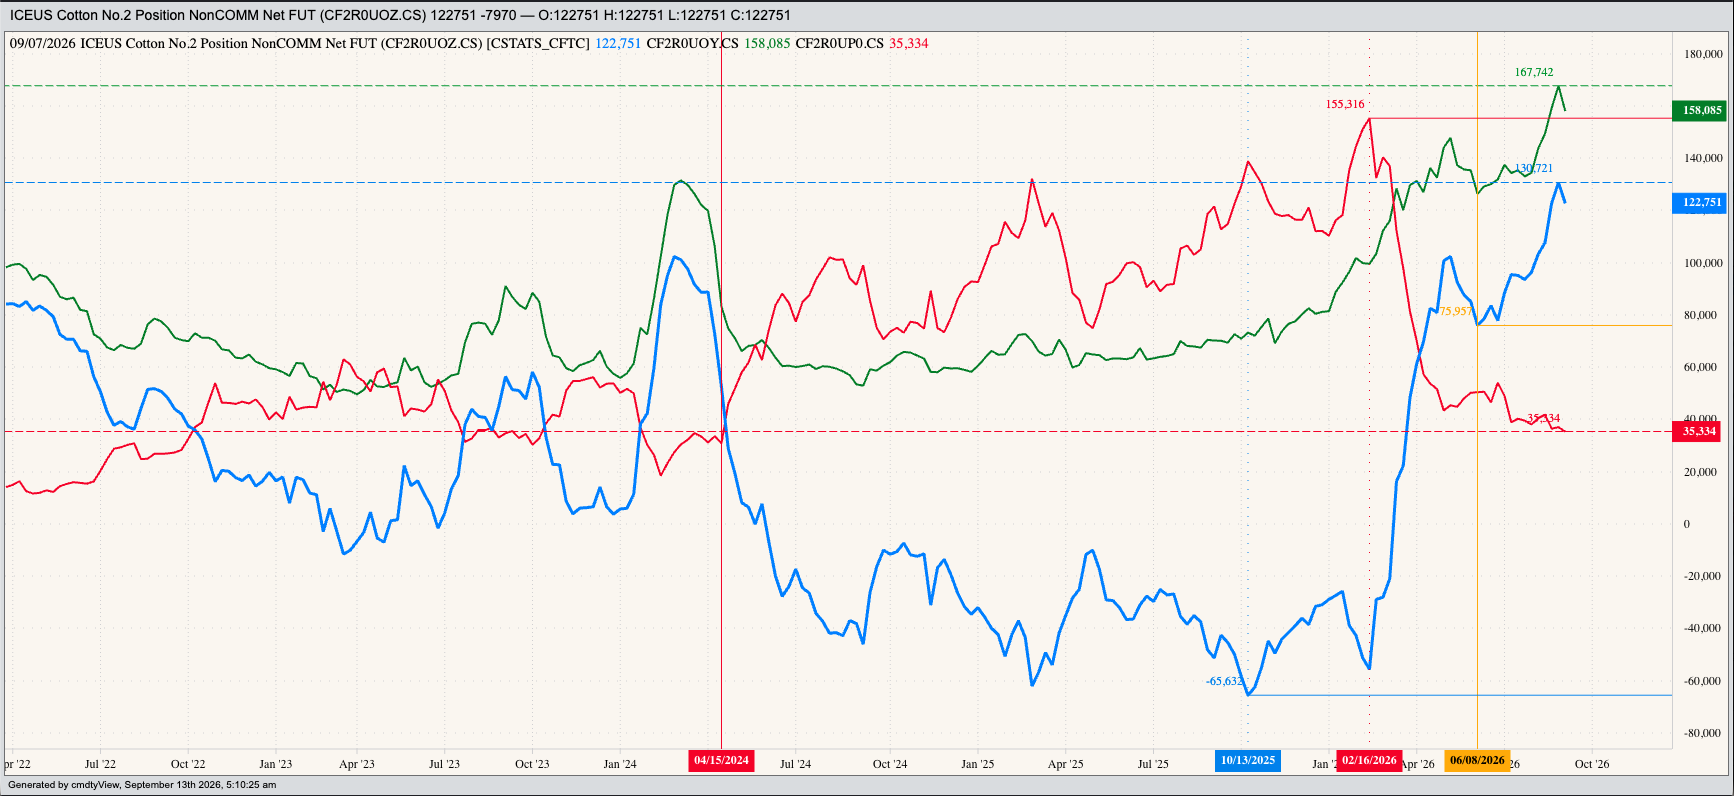
As usual, I’ll start with the noncommercial side. A look at the chart created by pulling numbers from weekly Commitments of Traders reports (legacy, futures only) shows funds held a record large net-short futures position of 65,632 contracts on Tuesday, October 14, 2025. As is often the case when a fund position moves to record numbers (those interested in Corn take note), a round of short covering (or long liquidation) soon follows. In. the case of cotton, funds moved to a record large short futures position of 155,316 contracts on February 17. The die was set.
As the market made its way through the spring quarter (March-April-May), funds covered their short futures, driving the net futures position to a net-long of 102,389 contracts on May 12, a switch of 168,000 contracts. Another look at Dec26’s weekly chart shows this change in fund position drove the futures contract 20.0 cents higher before it took a breather from mid-May through early June. We know what happened after that.
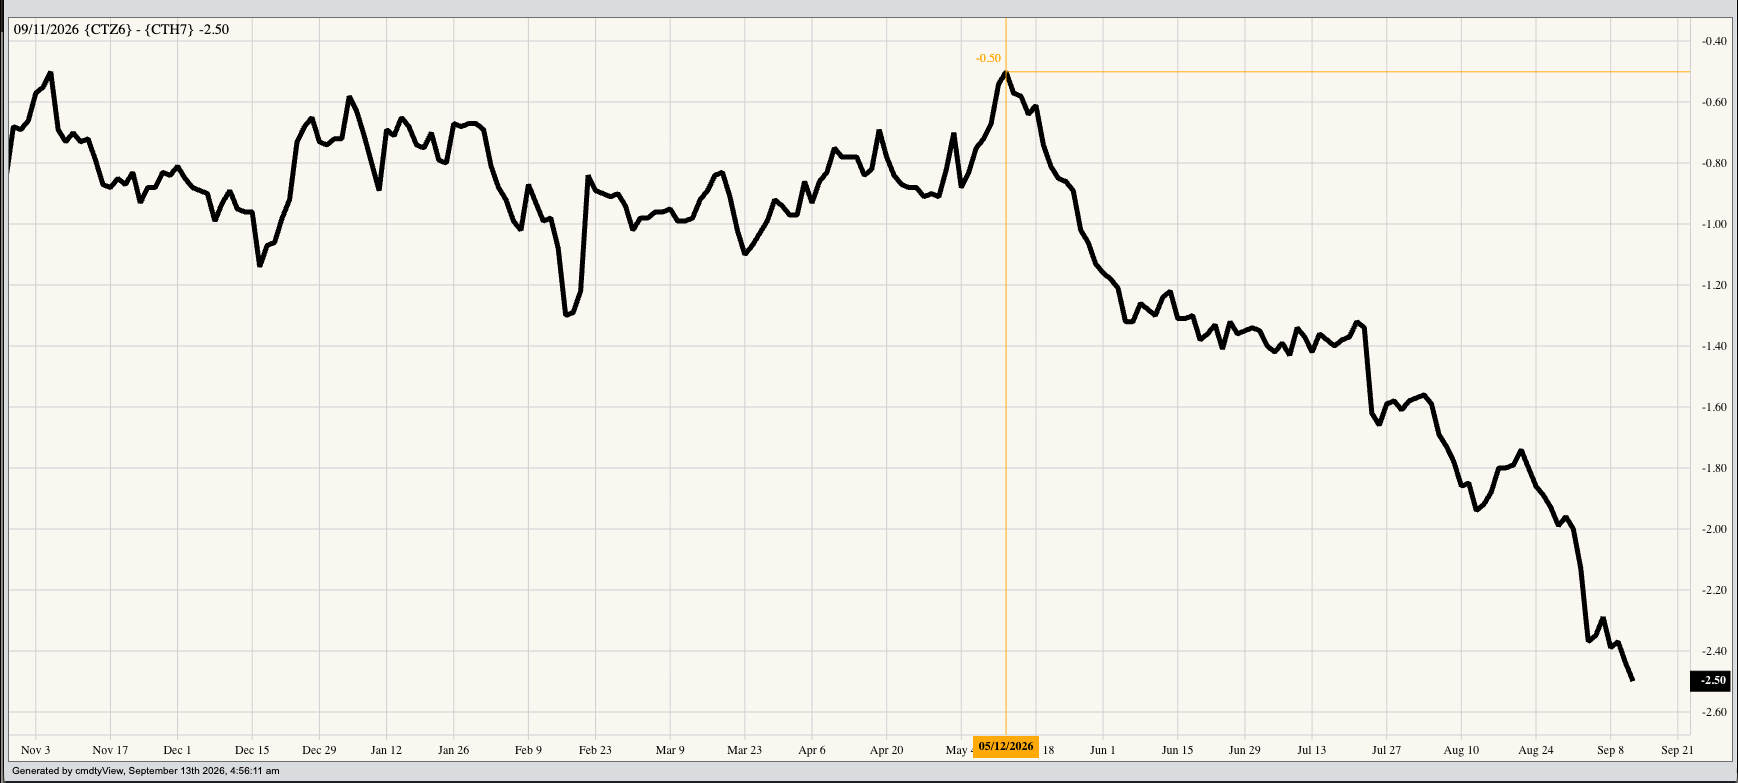
Did the fundamentals of the market turn incredibly bullish this past spring and summer? Let’s see what commercial interests were telling us. A look at the daily close-only chart for the Dec-March futures spread shows a sideways-to-up trend from March through mid-May, with a high daily close of 0.5 cent carry on May 12. (Does that date sound familiar? See above.) After that, the bottom fell out for the spread as commercial traders sold the noncommercial led rally. By the end of August, the carry had strengthened to 2.00 cents. But the sinking was done as this past Friday (September 11) the carry had firmed to 2.5 cents.
In other words, a classic Rubber Band Disposition had developed. What do I mean? The two sides making up the structure were pulling in different directions, like a rubber band being stretched. As we know, eventually the rubber band breaks, snapping back to its base. In commodities, and based on Market Rule #6 (Fundamentals win in the end), that base is fundamentals. Note that funds moved to a record large long futures position of 167,742 contracts and net-long futures position of 130,721 contracts on Tuesday, September 1. The rubber band was stretched about as far as it could go.
After posting the high of 93.74 on Monday, August 31, Dec26 hit a low of 85.77 before closing Friday at 86.06, down 0.27 for the week.
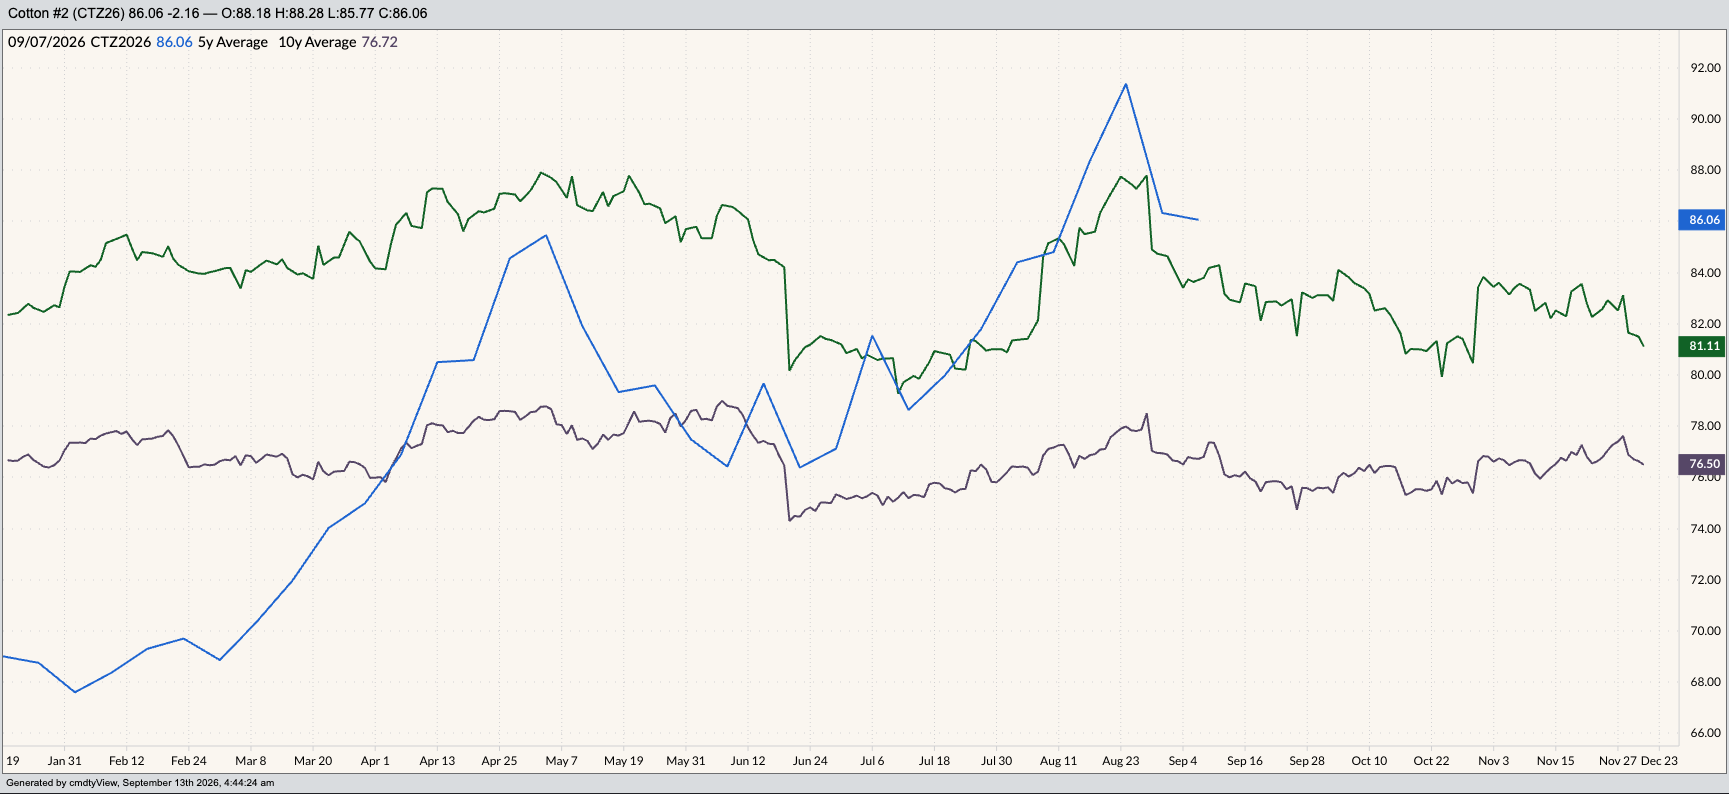
Did we have a warning such turn could happen as the Dog Days of Summer came to an end? Why, yes we did. Thank you for asking. If we look at a seasonal price chart we see late summer is usually when December cotton posts its yearly high. To zero in a bit clearer, if we look at a seasonal index chart we see the December contract tends to rally between 9% (5-year index) and 3% (10-year index) from early July through the last weekly close of August. From there Dec cotton tends to lose between 7% and 3% through the last weekly close of October.
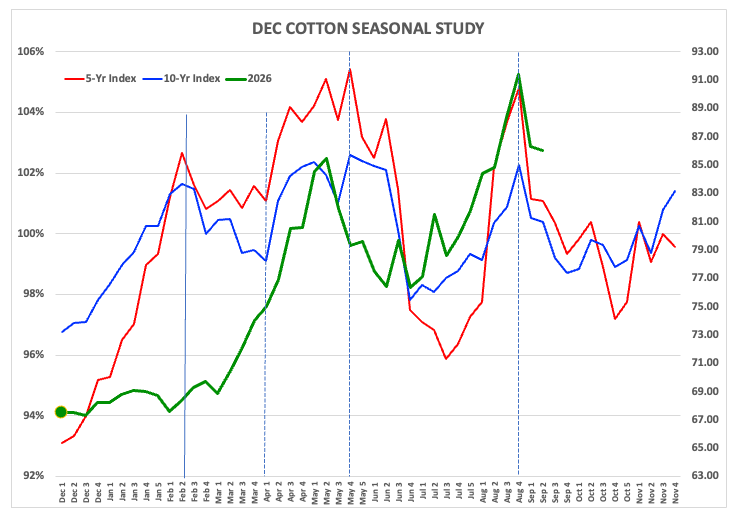
What was the high weekly close for the Dec26 contract? The last week of August, fittingly enough, was 91.38 meaning the issue did what its seasonal patterns told us tends to happen. In other words the market rallied when it was supposed to and started to break on cue. Was the rally larger than average? Yes. So I guess we can say the move was indeed bold, but again much of this was due to moving from record large short and net-short futures positions to record large long and net-long futures positions. (That is impressive if we take moment and think about it.)
What could come next for Dec cotton? Given funds still hold near record long and net-long futures and commercial interests continue to sell, and the fact the market tends to trend down this time of year, it would make sense for cotton to extend the secondary (intermediate-term) downtrend that has developed on its weekly chart. But we’ll see. Markets don’t have to do what make sense.
On the date of publication, Darin Newsom did not have (either directly or indirectly) positions in any of the securities mentioned in this article. All information and data in this article is solely for informational purposes. For more information please view the Barchart Disclosure Policy here.