


Berkshire Hathaway (BRK.B) Stock Could Be Below Fair Value Today
Berkshire Hathaway has delivered a solid 84.4% return over the past five years, yet current valuation checks suggest the stock still trades at a discount to its intrinsic value estimate based on an Excess Returns model. That mix of strong historical gains and a high value score raises a practical question for investors who care about what they are paying for each dollar of underlying business.
- The 84.4% five year return signals that Berkshire Hathaway has already rewarded patient shareholders, which makes any signal of further undervaluation especially important to scrutinize.
- Management’s decision to direct more than US$82b into share repurchases can support per share value. At the same time, the concentration of capital allocation decisions in a small leadership group may add key person risk for long term holders.
- The broader valuation checks, including the Excess Returns intrinsic value estimate and market multiples, point to Berkshire Hathaway screening cheap overall, with a value score of 5 that signals consistent undervaluation across methodologies.
The issue now is whether Berkshire Hathaway’s current share price already reflects this intrinsic value estimate or if a meaningful discount remains for investors who are comfortable with its capital allocation approach.
Scan 32 high quality undervalued stocks, which is hand picked to mirror Berkshire Hathaway’s combination of long term returns and a high value score supported by consistent undervaluation signals.
Is Berkshire Hathaway Still Cheap on Excess Returns?
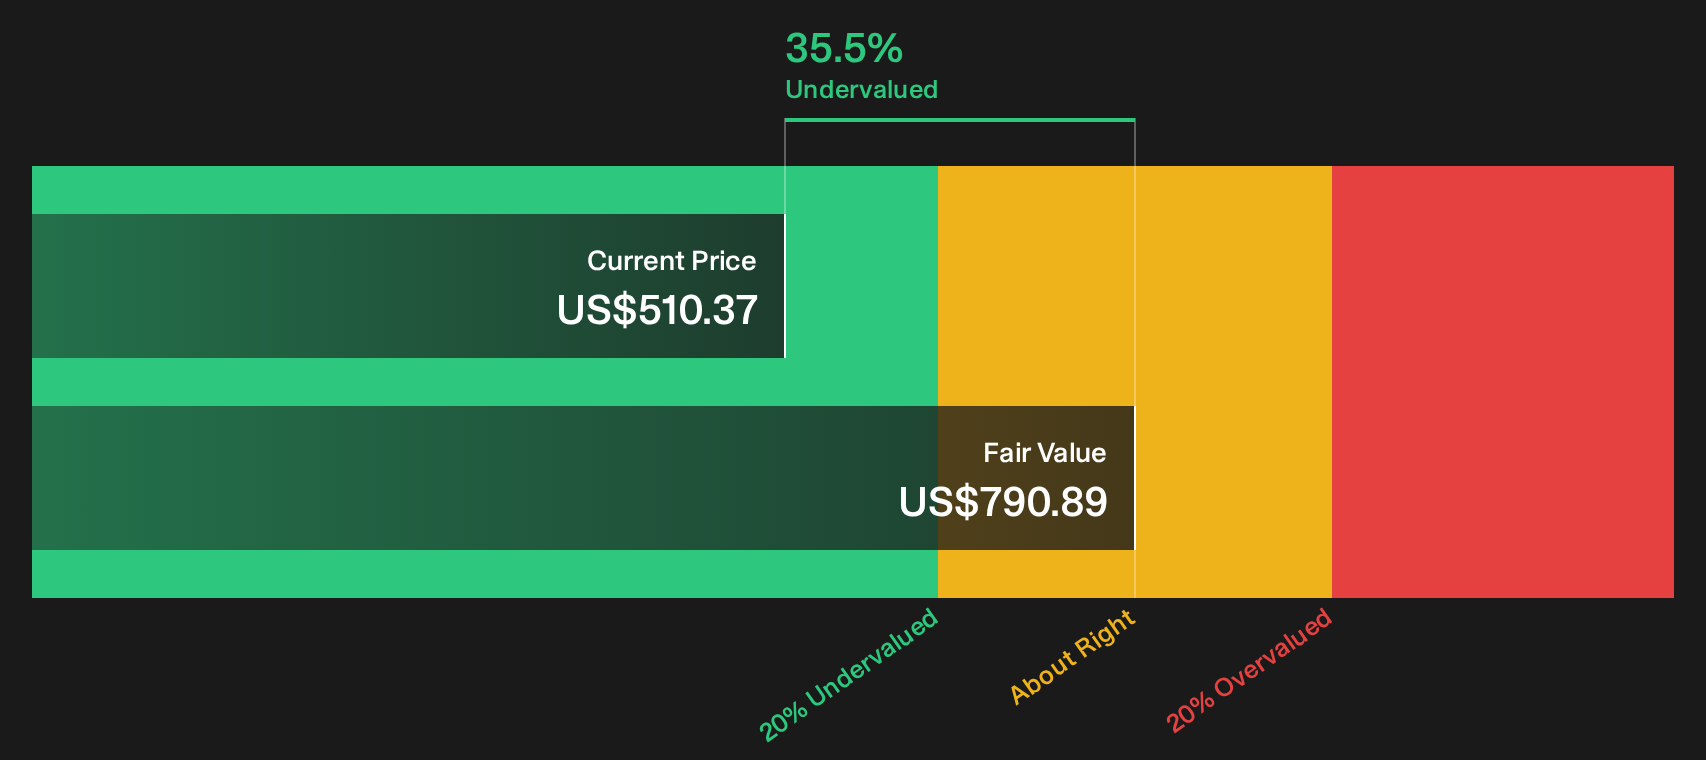
The Excess Returns model looks at how much profit Berkshire Hathaway can earn on shareholders’ equity above its own funding cost. For this stock, the gap between those two is wide in dollar terms. Stable EPS is estimated at $65,244.04 per share, while the cost of equity is put at $41,019.19 per share. This leaves an excess return of $24,224.85 per share on a stable book value base of $547,710.90 per share. That level of profitability lines up with an average return on equity of 11.91% and supports an intrinsic value estimate of $790.89 per share.
The current price of Berkshire Hathaway trades at a discount of about 35.5% to that Excess Returns estimate, so the model signals the stock looks undervalued on these assumptions. Warren Buffett’s handover of day to day control to Greg Abel and the more than $82b of share repurchases provide a simple read through. Despite the leadership transition and active buyback program, the market is still valuing Berkshire Hathaway below what this earnings power model suggests.
On this Excess Returns view, Berkshire Hathaway screens clearly undervalued relative to its modeled intrinsic worth.
Our Excess Returns analysis suggests Berkshire Hathaway is undervalued by 35.5%. Track this in your watchlist or portfolio, or discover 32 more high quality undervalued stocks.
Is Berkshire Hathaway Still Cheap on Earnings?
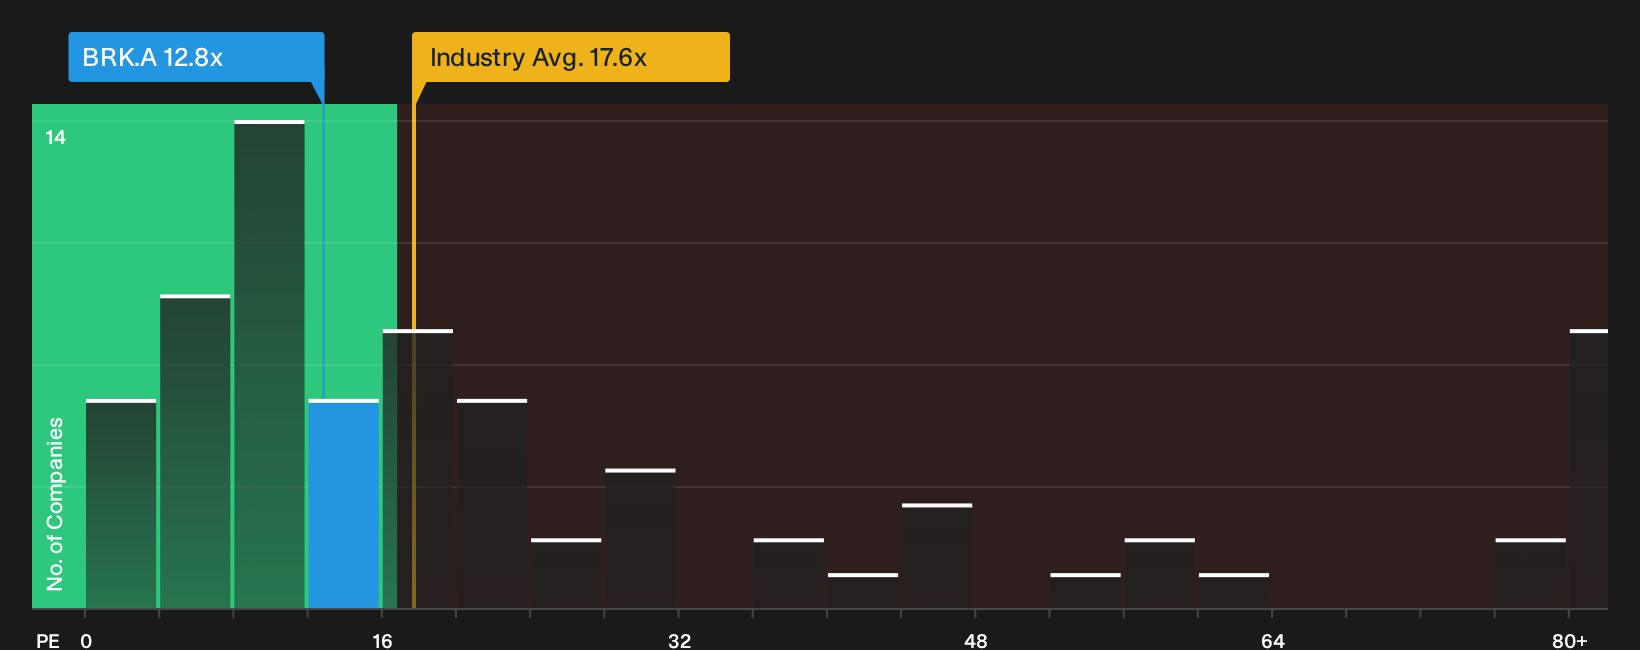
P/E fits Berkshire Hathaway reasonably well because earnings remain a key anchor for how investors look at the group’s mix of operating businesses and investments. On this metric, the stock trades at about 12.8x earnings, which is below both the diversified financial industry average of roughly 17.6x and a broader peer group closer to 23.5x.
The tailored fair P/E ratio for Berkshire Hathaway is estimated at 16.2x, based on its size, margins, sector and risk profile. That is several turns higher than the current 12.8x. This implies the market is pricing the earnings stream at a discount even before you factor in book value or cash flow work. For investors who care about what they are paying per dollar of profit, the current multiple suggests the stock is not being priced like a premium financial conglomerate.
On the P/E yardstick, Berkshire Hathaway appears undervalued relative to both its customized fair multiple and standard industry benchmarks.
See what the numbers say about this price — find out in our valuation breakdown.
The Berkshire Hathaway Narrative: What Would Justify Today's Price?
Simply Wall St Narratives pick up where the Berkshire Hathaway valuation puzzle leaves off. They explain which future path for Berkshire Hathaway's earnings, margins and reinvestment would need to hold for the stock to be worth materially more or less than today’s price. Instead of a single multiple or model number, each narrative lays out the assumptions behind its fair value so you can test those against actual results over time on the Community page.
You can add your voice to the Berkshire Hathaway conversation by sharing a Narrative that lays out a numbers based view on whether more than US$82b of buybacks and the leadership handover to Greg Abel eventually deliver on the company’s earnings power. Put a clear, data driven case on the stock and track how that thesis holds up as fresh results arrive.
Do you think there's more to the story for Berkshire Hathaway? Head over to our Community to see what others are saying!
The Bottom Line
Berkshire Hathaway screens undervalued on both the Excess Returns intrinsic value estimate and on earnings multiples, which point in the same direction rather than fighting each other. That combination only really pays off for new capital if the market eventually assigns a richer P/E to the earnings stream. The key debate from here is whether concentrated capital allocation and key person risk are already fully priced in, or whether they are exactly why the discount persists.
This article by Simply Wall St is general in nature. We provide commentary based on historical data and analyst forecasts only using an unbiased methodology and our articles are not intended to be financial advice. It does not constitute a recommendation to buy or sell any stock, and does not take account of your objectives, or your financial situation. We aim to bring you long-term focused analysis driven by fundamental data. Note that our analysis may not factor in the latest price-sensitive company announcements or qualitative material. Simply Wall St has no position in any stocks mentioned.
Have feedback on this article? Concerned about the content? Get in touch with us directly. Alternatively, email editorial-team@simplywallst.com