


Wealthfront (WLTH) Dropped, So What Is Driving Attention Now?
Wealthfront (WLTH) has two fresh data points for investors after its 9 September update: a second quarter earnings release and a completed buyback covering 4.29% of outstanding shares.
Wealthfront’s recent buyback and earnings release landed against a backdrop of mixed price performance, with an 8.35% 7 day share price return and a 13.57% 30 day share price return contrasting with a year to date share price decline of 21.48%. This suggests short term momentum may be rebuilding after a tougher stretch.
Compare Wealthfront’s recent buyback and earnings reset with other potential rebound candidates by scanning our curated list of 31 high quality undervalued stocks with improving momentum and solid fundamentals.
Bulls see Wealthfront’s buyback and recent profit as a signal the market is underpricing the business. Bears point to softer earnings per share. Which story do the current valuation markers lean toward?
Most Popular Narrative: 15.8% Undervalued
On the most followed narrative, Wealthfront’s fair value of $12.33 sits above the latest close at $10.38. This frames today’s buyback and earnings in a valuation gap that still looks open.
The client base is concentrated in digital natives with an average age of 38 years, and this group holds US$16t of household net worth that is projected in the call to grow at 11% annually over two decades, which can support higher platform assets and advisory revenue over time.
Want to understand why this narrative still points to upside for Wealthfront? The crux is how future revenue, margin expansion and share count work together in that $12.33 figure. The full narrative unpacks the earnings path, the assumed profitability shift and the valuation multiple that need to line up for this gap to close.
Result: Fair Value of $12.33 (UNDERVALUED)
Have a read of the narrative in full and understand what's behind the forecasts.
Still, the Wealthfront story can break if referral-driven client growth softens or if newer products, such as home lending, scale more slowly than analysts model.
Find out about the key risks to this Wealthfront narrative.
Another View: Wealthfront Through Sales Multiples
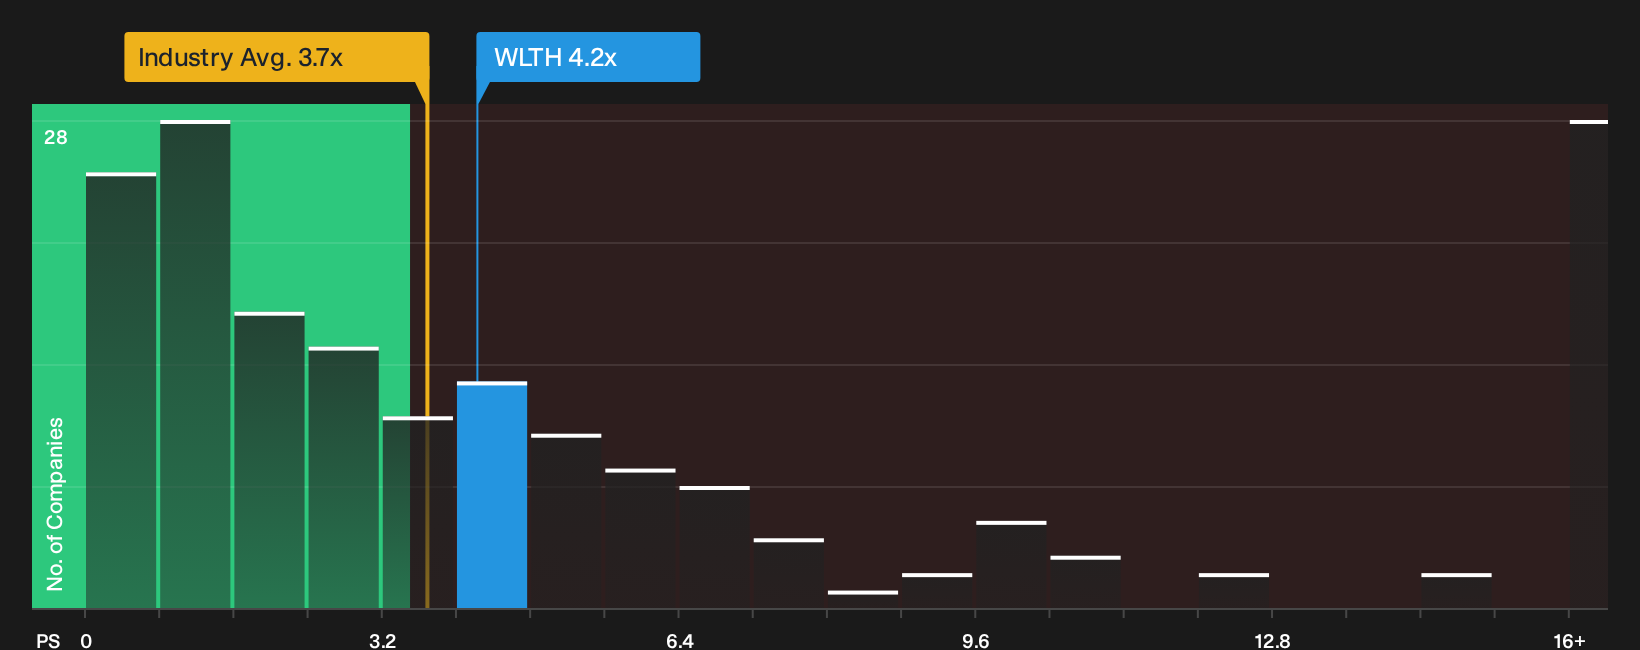
While the SWS narrative flags Wealthfront as 33% below its fair value, the P/S picture is less straightforward. WLTH trades at 4.2x sales, above the US Capital Markets average of 3.7x, and above a fair ratio estimate of 2.6x. That mix of discount on one model and richer sales multiple on another raises a simple question: Which signal do you trust more when real money is on the line?
See what the numbers say about this price — find out in our valuation breakdown.
Next Steps
Sentiment on Wealthfront is split, so treat this as your cue to review the numbers yourself and decide quickly where you stand. To see what the optimistic crowd is focusing on, check the 3 key rewards.
Looking for more Wealthfront sized investment ideas?
If Wealthfront has sharpened your focus, do not stop here. Use fresh data driven lists to uncover other stocks that match your risk and return preferences.
- Target resilient payers by scanning a hand picked set of income opportunities through the 6 dividend fortresses.
- Hunt for stronger balance sheets by filtering financially robust businesses via this focused list of solid balance sheet and fundamentals (23 results).
- Spot early stage potential by checking a curated pool of less followed opportunities in the 15 high quality undiscovered gems.
This article by Simply Wall St is general in nature. We provide commentary based on historical data and analyst forecasts only using an unbiased methodology and our articles are not intended to be financial advice. It does not constitute a recommendation to buy or sell any stock, and does not take account of your objectives, or your financial situation. We aim to bring you long-term focused analysis driven by fundamental data. Note that our analysis may not factor in the latest price-sensitive company announcements or qualitative material. Simply Wall St has no position in any stocks mentioned.
Have feedback on this article? Concerned about the content? Get in touch with us directly. Alternatively, email editorial-team@simplywallst.com