


St. Joe (JOE) Shares Climbed, So What Is Behind The Move?
St. Joe (JOE) has launched Watersound Weddings & Events, a new unit that centralizes wedding and special event planning across its hospitality properties in Florida’s Bay and Walton counties.
Recent price action around St. Joe reflects this expanding hospitality focus, with a 1-day share price return of 3.07% and a year-to-date share price gain of 10.12% at a last close of US$65.86. The 1-year total shareholder return of 28.15% points to momentum that has been building over time rather than fading.
Scan for other real estate and hospitality stocks showing similar momentum and financial strength using our curated 16 high quality undiscovered gems.
St. Joe now has a broader hospitality platform and a share price that has already moved, which raises a simple tension: Is this a strong business at a stretched tag or still reasonably priced?
Preferred P/E of 30.5x: Is it justified for St. Joe?
St. Joe is priced at a P/E of 30.5x while the stock last closed at $65.86, which places it above both its industry and peer averages.
The P/E ratio compares the current share price with earnings per share and gives a quick sense of how much investors are paying for each dollar of profit. For a real estate development and hospitality group like St. Joe, this metric often reflects expectations around earnings resilience and the quality of existing cash flows rather than rapid top line expansion.
Earnings growth has been strong, with profit up 48.7% over the past year and averaging 10.2% per year over five years, and net profit margins of 22.5% compared with 19.4% last year. These figures, along with an assessment of high quality earnings, help explain why the market is assigning a richer multiple, even though return on equity of 16% is described as low and the firm carries a high level of debt funded entirely by external borrowing.
Against that backdrop, the P/E of 30.5x looks expensive compared with the US Real Estate industry average of 16.3x and a peer average of 26.1x. The market is assigning St. Joe a premium over both groups, which suggests investors are paying more for its earnings profile than for the broader sector or close comparables.
See what the numbers say about this price — find out in our valuation breakdown.
Result: Price-to-Earnings of 30.5x (OVERVALUED)
Still, St. Joe leans heavily on a single coastal region and carries high debt, so shifts in travel demand or financing costs could quickly pressure that premium.
Find out about the key risks to this St. Joe narrative.
Another view on St. Joe’s value
The earnings multiple paints St. Joe as expensive, yet the SWS DCF model points a different way. At a share price of $65.86, the stock is described as trading 57.8% below an estimated future cash flow value of $156.13, which frames today’s tag as a possible discount rather than a premium.
This kind of gap can cut both ways. It could mean the market is cautious about debt, regional concentration and future profitability, or it could mean investors are underpricing the cash flows implied by current performance. Which signal do you think is closer to reality for St. Joe right now?
Look into how the SWS DCF model arrives at its fair value.
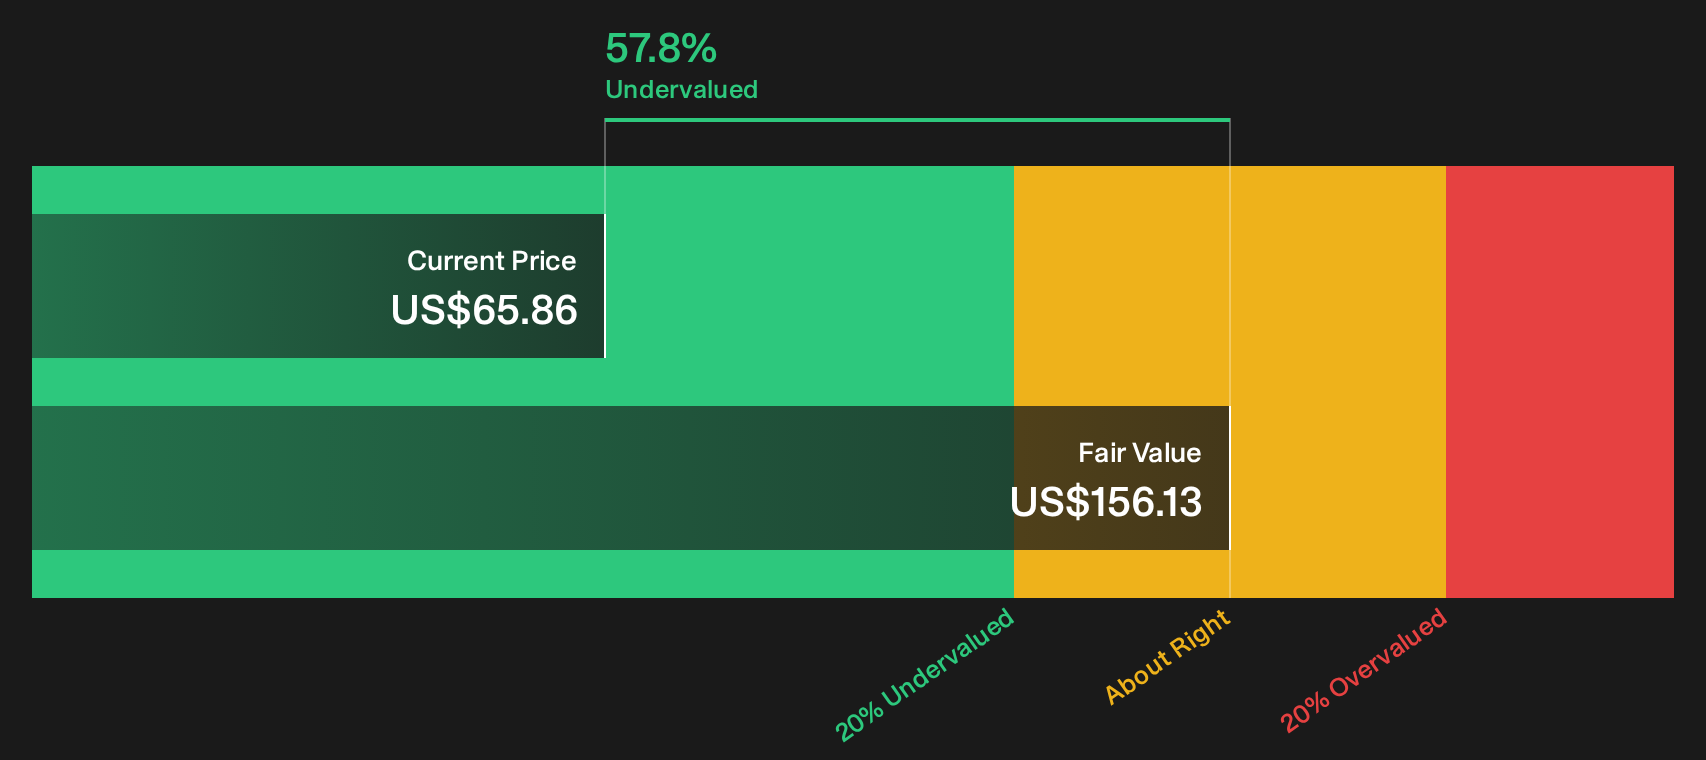
Simply Wall St performs a discounted cash flow (DCF) on every stock in the world every day (check out St. Joe for example). We show the entire calculation in full. You can track the result in your watchlist or portfolio and be alerted when this changes, or use our stock screener to discover 31 high quality undervalued stocks. If you save a screener we even alert you when new companies match - so you never miss a potential opportunity.
Next Steps
Mixed signals around St. Joe’s valuation and risk profile make this a stock where your own homework really matters, so move fast, analyze the underlying figures in detail, and weigh both sides of the story by reviewing the 2 key rewards and 1 important warning sign
Looking for more investment ideas beyond St. Joe?
If St. Joe has your attention, broaden your watchlist with a few focused stock ideas that match different risk levels and income goals using the Simply Wall St Screener.
- Target potential bargains by scanning for solid businesses that combine quality fundamentals with discounted valuations using our 31 high quality undervalued stocks.
- Build a steadier income stream by assessing companies with robust payouts and generous yields through the 6 dividend fortresses.
- Dial down volatility by concentrating on companies with stronger balance sheets and healthier financial profiles via the list of solid balance sheet and fundamentals (23 results).
This article by Simply Wall St is general in nature. We provide commentary based on historical data and analyst forecasts only using an unbiased methodology and our articles are not intended to be financial advice. It does not constitute a recommendation to buy or sell any stock, and does not take account of your objectives, or your financial situation. We aim to bring you long-term focused analysis driven by fundamental data. Note that our analysis may not factor in the latest price-sensitive company announcements or qualitative material. Simply Wall St has no position in any stocks mentioned.
Have feedback on this article? Concerned about the content? Get in touch with us directly. Alternatively, email editorial-team@simplywallst.com