


Ecolab (ECL) Stock Looks Reasonable On Cash Flow But Rich On Earnings
Ecolab has delivered a strong share price run over the past three years, yet today the stock trades on multiples that screen expensive while an intrinsic value estimate points to something closer to fair value than a clear bargain. For anyone tracking valuation, that mix makes Ecolab look more like a quality business at a full price than a straightforward value opportunity.
- Ecolab has returned about 60.1% over three years, which signals that a lot of optimism is already reflected in the current share price.
- The company’s recurring service model can support steady cash generation, but any disappointment in future margin progress may weigh heavily on what investors are willing to pay.
- The broader checks show a low value score, with Ecolab screening as not undervalued in any of six tests. This suggests the stock leans expensive rather than being a clear bargain on these metrics.
The issue now is whether Ecolab’s current US$276.18 price already fully reflects its intrinsic value or still leaves enough upside potential to interest long term investors.
Compare Ecolab’s rich valuation with a curated list of other quality businesses that still screen attractively on fundamentals using the 31 high quality undervalued stocks.
Is Ecolab Fairly Priced on Cash Flow?
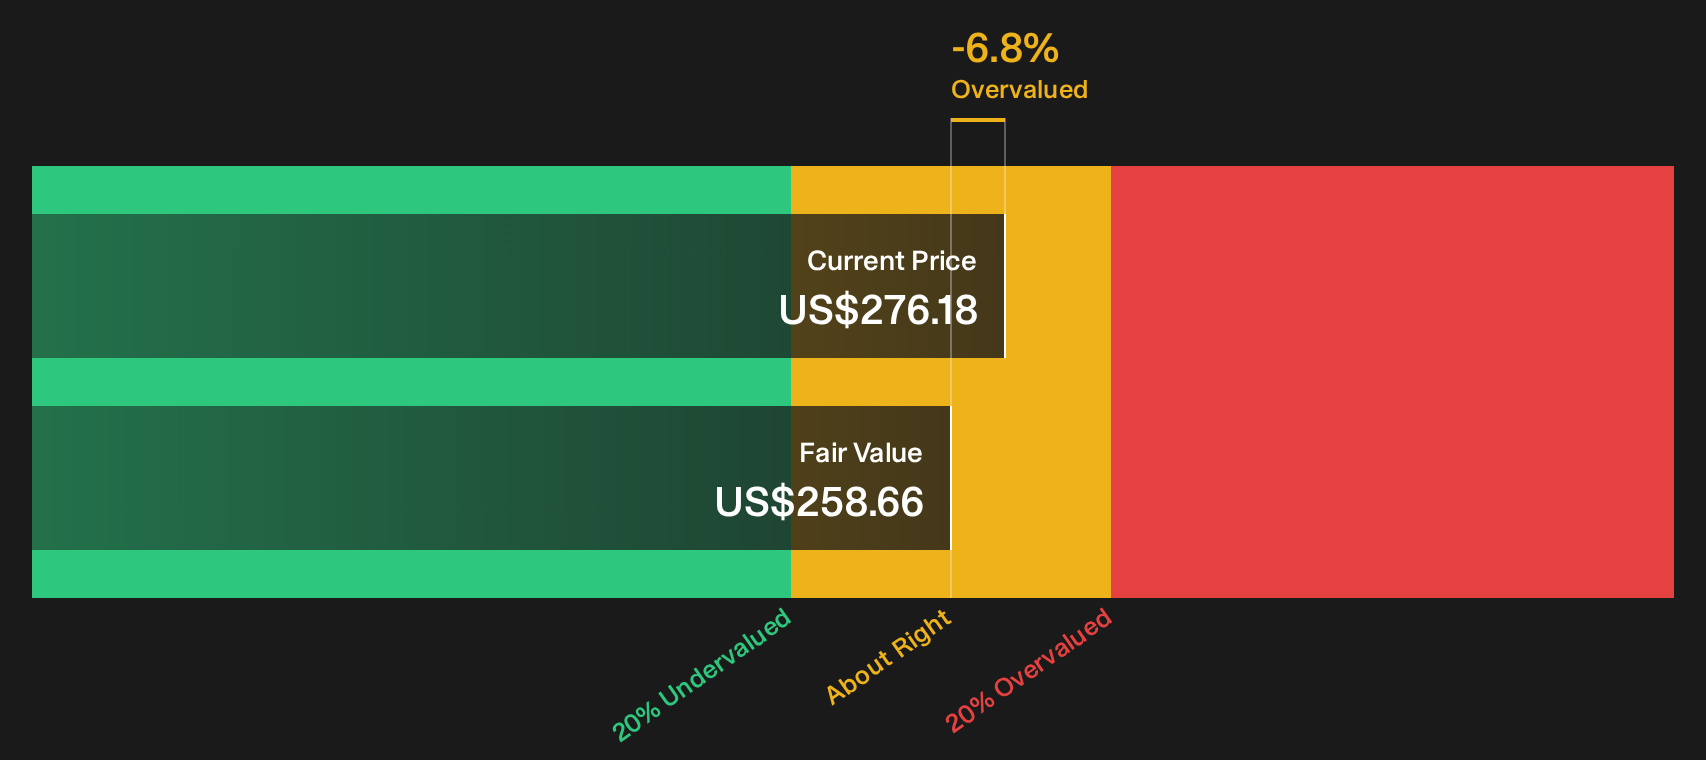
The Discounted Cash Flow (DCF) model here focuses on what Ecolab can earn in cash over time rather than short term swings in reported profit. On this view, the business generated about $2.0b of free cash flow over the last twelve months, with the model assuming those cash flows keep growing from this base rather than shrinking. That stream of expected future cash, discounted back to today, produces an estimated intrinsic value of about $258.66 per share.
Compared with the current share price of $276.18, the DCF outcome implies the stock trades roughly 6.8% above that intrinsic estimate. On this basis, Ecolab screens as a quality operation with a slightly rich tag rather than a clear discount. Following this model, any investor paying today’s price is relying more on the strength and resilience of the franchise than on a margin of safety in the valuation.
On this cash flow view, Ecolab appears to be roughly fairly valued, with the market only modestly ahead of the model’s intrinsic worth.
Ecolab is fairly valued according to our Discounted Cash Flow (DCF), but this can change at a moment's notice. Track the value in your watchlist or portfolio and be alerted on when to act.
Does Ecolab Look Pricey on Earnings?
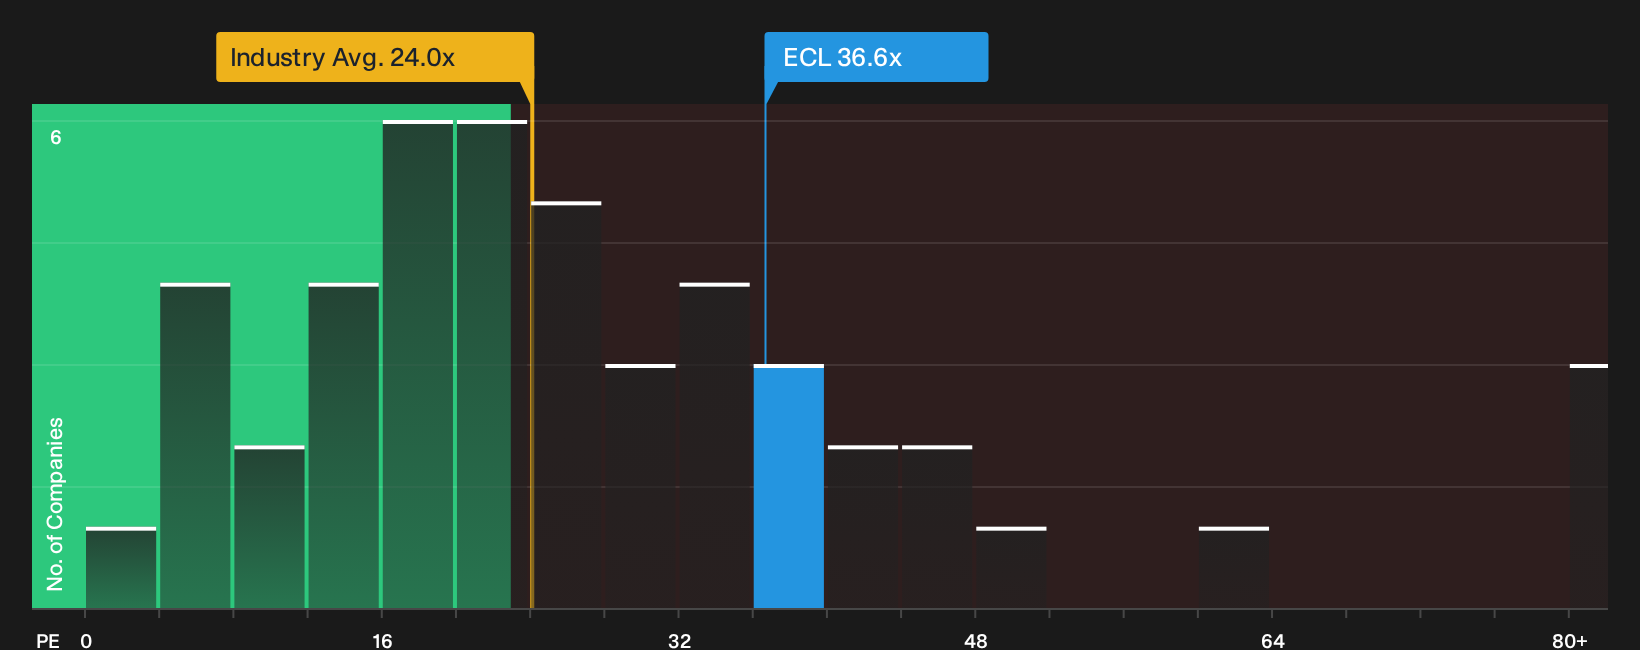
P/E fits Ecolab well because the group produces positive earnings and is widely followed on reported profit. On this measure, the stock trades on about 36.6x earnings, compared with an industry average near 24.0x and a broader peer group closer to 19.5x. That is a sizeable premium for a chemicals business.
The fair P/E ratio implied by the model is about 24.7x, which already factors in Ecolab’s sector, size and risk profile. The current multiple sits well above that level, so the market is paying a high price for each dollar of profit relative to what this framework suggests is reasonable.
On the P/E yardstick, Ecolab appears overvalued, with investors currently paying a rich premium versus both peers and the modelled fair multiple.
See what the numbers say about this price — find out in our valuation breakdown.
The Ecolab Narrative: What Would Justify Today's Price?
Narratives on Simply Wall St set out clear scenarios for Ecolab's future so you can see which mix of growth, profitability and earnings power would make today's valuation look stretched or conservative. Each one focuses on the assumptions that sit behind its view of fair value, rather than a single model output, so you can track those expectations against Ecolab's actual results over time on the Community page.
Share a narrative on Ecolab that provides a clear, number-driven case for where its growth, margins, and execution may go from here. Then track how that thesis holds up as new results arrive. Add your voice and be one of the first contributors in the Simply Wall St community shaping how investors interpret this valuation story.
Do you think there's more to the story for Ecolab? Head over to our Community to see what others are saying!
The Bottom Line
Ecolab now appears closer to fully priced than mispriced. The Discounted Cash Flow (DCF) view puts intrinsic value slightly below the current quote, while the P/E work suggests the shares trade at a premium that already reflects strong expectations. With broader valuation checks also weak, the key question is whether Ecolab can continue delivering on margins and cash generation strongly enough to support that richer valuation, rather than offering a clear valuation gap today.
This article by Simply Wall St is general in nature. We provide commentary based on historical data and analyst forecasts only using an unbiased methodology and our articles are not intended to be financial advice. It does not constitute a recommendation to buy or sell any stock, and does not take account of your objectives, or your financial situation. We aim to bring you long-term focused analysis driven by fundamental data. Note that our analysis may not factor in the latest price-sensitive company announcements or qualitative material. Simply Wall St has no position in any stocks mentioned.
Have feedback on this article? Concerned about the content? Get in touch with us directly. Alternatively, email editorial-team@simplywallst.com