


Is El Al Israel Airlines (TASE:ELAL) A Bargain After Its Recent Pullback?
El Al Israel Airlines (TASE:ELAL) has drawn fresh attention after recent trading left the share price at ₪16.40. This development is prompting investors to reassess the airline’s valuation, risk profile, and recent return pattern.
Recent trading has cooled short term momentum, with the share price down 2.50% over one day and 4.32% over the week. However, El Al Israel Airlines still carries a 90 day share price return of 23.12% and a five year total shareholder return above 5x, which signals that optimism built over several years is now being tested in the near term as investors reassess both upside potential and risk.
Compare El Al Israel Airlines with a curated set of peers by scanning the 618 high quality undiscovered gems that have been quietly building strong fundamentals away from the headlines.
Bulls see El Al Israel Airlines as a profitable carrier trading at a significant intrinsic discount. Bears point to the recent loss of momentum. Which side does the current valuation support next?
Price-to-Earnings of 10.5x: Is it justified?
On recent figures, El Al Israel Airlines trades on a P/E of 10.5x at a share price of ₪16.40. This suggests the market values its earnings at a lower level than both peers and the wider Asian airlines group.
The P/E ratio compares what investors currently pay for each unit of profit. For an airline such as El Al Israel Airlines, which reports net income of ₪305.6m from revenue of ₪3,474.1m, this earnings-based lens shows how the market is pricing its profitability relative to similar carriers.
This profitability picture is not one way. El Al Israel Airlines has high quality earnings and a Return on Equity of 27.8%. However, profit margins of 8.8% are lower than last year’s 13.8%, and earnings over the past year declined 35%. These factors may help explain why the P/E sits where it does, despite the longer term move from losses to profitability over the past five years.
The market is currently assigning a 10.5x earnings multiple to El Al Israel Airlines, while the Asian airlines industry trades around 14.6x and the peer average sits closer to 22.3x. This is a substantial gap and suggests investors are pricing its profits at a discount relative to comparable businesses.
See what the numbers say about this price — find out in our valuation breakdown..
Result: Price-to-Earnings of 10.5x (UNDERVALUED)
Still, that 35% earnings decline and lower profit margin leave El Al Israel Airlines vulnerable if travel demand softens or if operational costs rise further.
Find out about the key risks to this El Al Israel Airlines narrative.
Another View on El Al Israel Airlines: Cash Flows vs Earnings
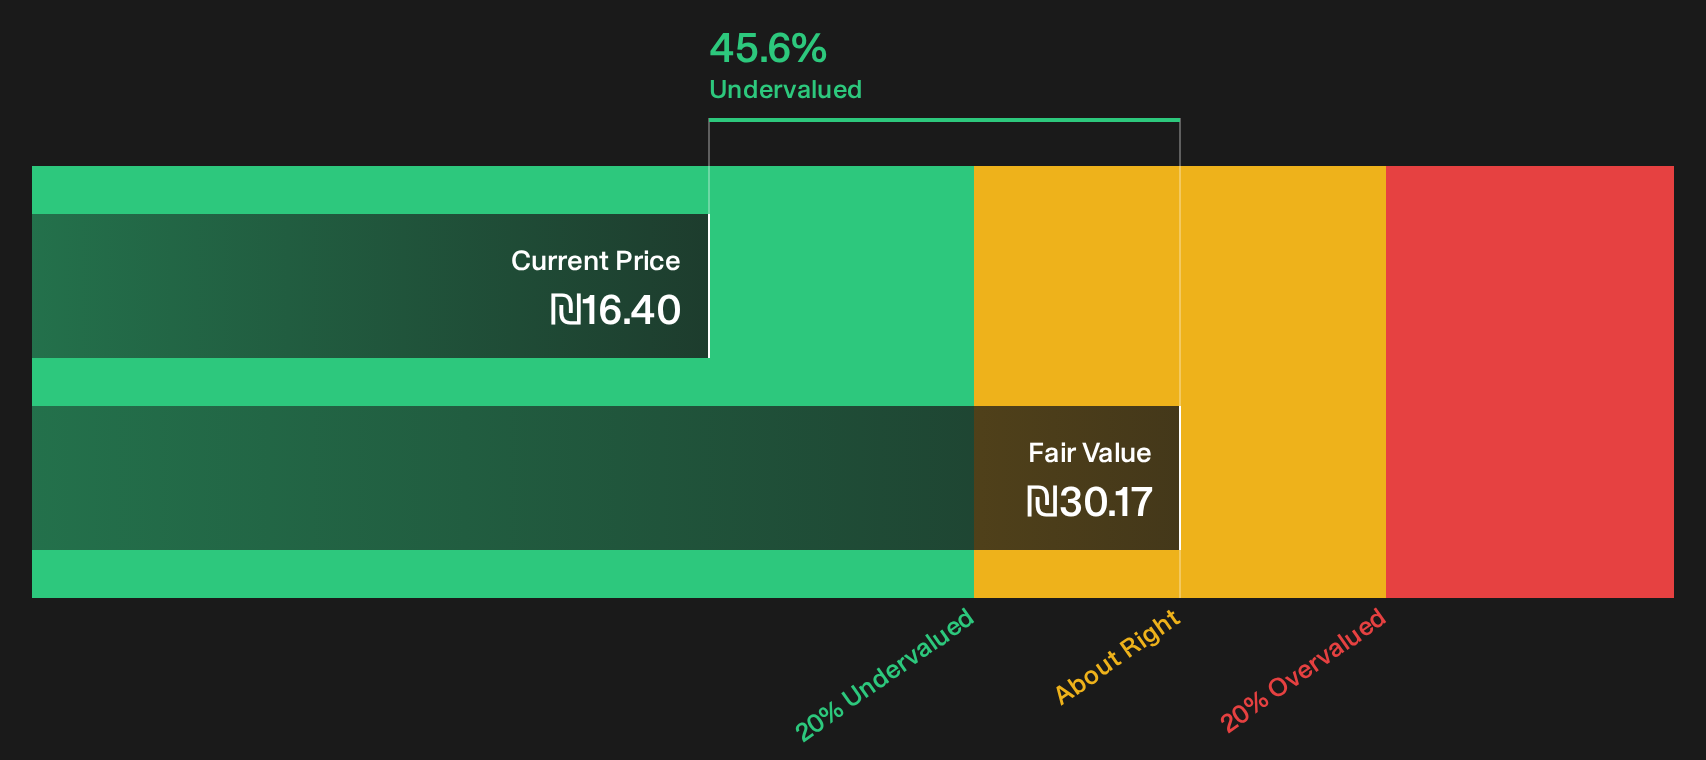
The earnings multiple presents El Al Israel Airlines as relatively cheap, and the SWS DCF model appears even more aggressive. At a share price of ₪16.40, the stock is trading about 45.6% below the modelled future cash flow value of ₪30.17, which frames the airline as deeply undervalued on this basis.
That kind of gap can signal opportunity if cash flows hold up, or it can reflect concern about future profitability and risk. Which explanation fits El Al Israel Airlines best in your view?
Look into how the SWS DCF model arrives at its fair value.
Simply Wall St performs a discounted cash flow (DCF) on every stock in the world every day (check out El Al Israel Airlines for example). We show the entire calculation in full. You can track the result in your watchlist or portfolio and be alerted when this changes, or use our stock screener to discover 183 high quality undervalued stocks. If you save a screener we even alert you when new companies match - so you never miss a potential opportunity.
Next Steps
Sentiment around El Al Israel Airlines is split. Bulls and bears both have data on their side, so move quickly, examine the underlying numbers, and weigh the 1 key reward and 2 important warning signs carefully.
Looking for more investment ideas beyond El El Israel Airlines?
If you only stop at El Al Israel Airlines, you might miss other opportunities that fit your goals even better, so put the wider market to work for you.
- Target deep value by scanning the 183 high quality undervalued stocks that combine compressed valuations with solid underlying fundamentals.
- Prioritise resilience by reviewing the 97 resilient stocks with low risk scores that score well on financial health and business stability.
- Strengthen your core holdings by focusing on a list of solid balance sheet and fundamentals (194 results) that can better withstand shocks and funding pressures.
This article by Simply Wall St is general in nature. We provide commentary based on historical data and analyst forecasts only using an unbiased methodology and our articles are not intended to be financial advice. It does not constitute a recommendation to buy or sell any stock, and does not take account of your objectives, or your financial situation. We aim to bring you long-term focused analysis driven by fundamental data. Note that our analysis may not factor in the latest price-sensitive company announcements or qualitative material. Simply Wall St has no position in any stocks mentioned.
Have feedback on this article? Concerned about the content? Get in touch with us directly. Alternatively, email editorial-team@simplywallst.com