


Agilent (A) Stock May Be 23% Below Fair Value Despite Digital Pathology Launch
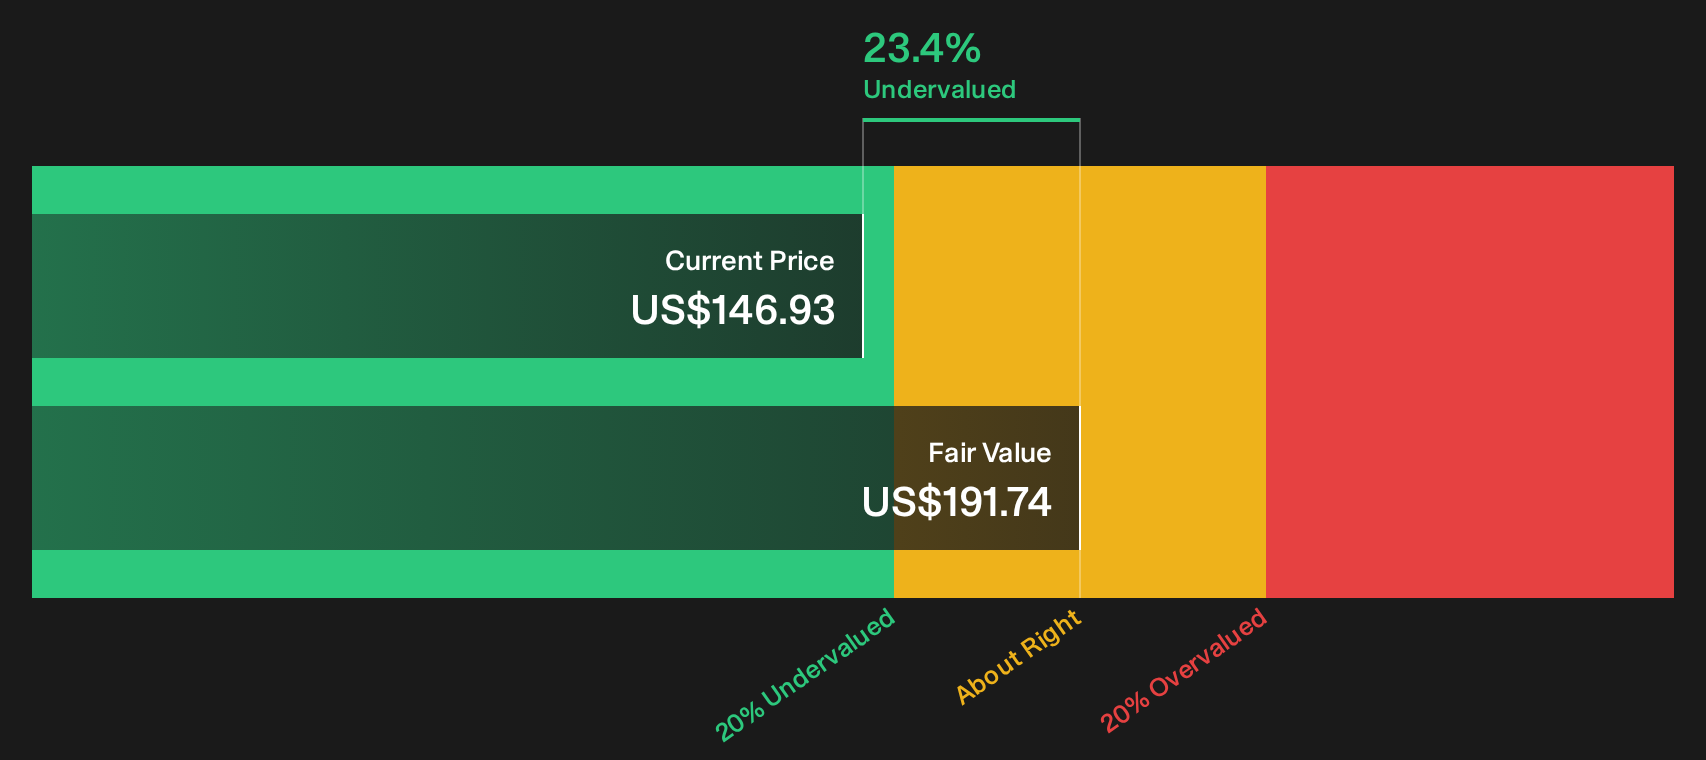
Agilent Technologies is coming off a 3 year gain of about 29.7%, yet its current valuation checks send mixed signals, with the Discounted Cash Flow (DCF) estimate pointing to undervaluation while market multiples lean the other way. The share price around US$146.93 also sits against a mid range value score, which keeps the debate open rather than resolved.
- A roughly 29.7% rise over 3 years suggests Agilent Technologies has rewarded patient holders, without being an extreme momentum story.
- New products in digital pathology and lab instrumentation can support future cash generation. However, any slowdown in adoption or weaker demand in core lab spending may cap what investors are willing to pay.
- The value checks show a mixed picture rather than a clear bargain or clear overpricing. Even so, the 4.0 score and a Discounted Cash Flow (DCF) estimate that sits about 23.4% above the market price suggest some upside against richer trading multiples.
The issue now is whether Agilent Technologies deserves the current premium multiples or whether the intrinsic value estimate is closer to the mark for long term investors.
Spot opportunities that rhyme with Agilent Technologies by scanning our hand picked solid balance sheet and fundamentals stocks screener (23 results) for ideas with similar financial resilience.Does Agilent Technologies Look Undervalued on Cash Flow?
The Discounted Cash Flow method looks at the cash Agilent Technologies is projected to generate and brings it back to today in dollar terms. Agilent produced about $1.21b in free cash flow over the last twelve months, and the model assumes that this is growing rather than shrinking over time. On that basis, the 2 Stage Free Cash Flow to Equity model points to an estimated intrinsic value of about $192 per share.
Against a recent price near $146.93, that implies the stock screens as undervalued by roughly 23.4%. The launch of the S540MD digital pathology slide scanner adds another potential use case for Agilent Technologies equipment, yet the market valuation still trails what this cash flow view supports.
On this DCF view, Agilent Technologies stock appears undervalued relative to the current share price.
Our Discounted Cash Flow (DCF) analysis suggests Agilent Technologies is undervalued by 23.4%. Track this in your watchlist or portfolio, or discover 31 more high quality undervalued stocks.
Has Agilent Technologies Run Too Far on Earnings?
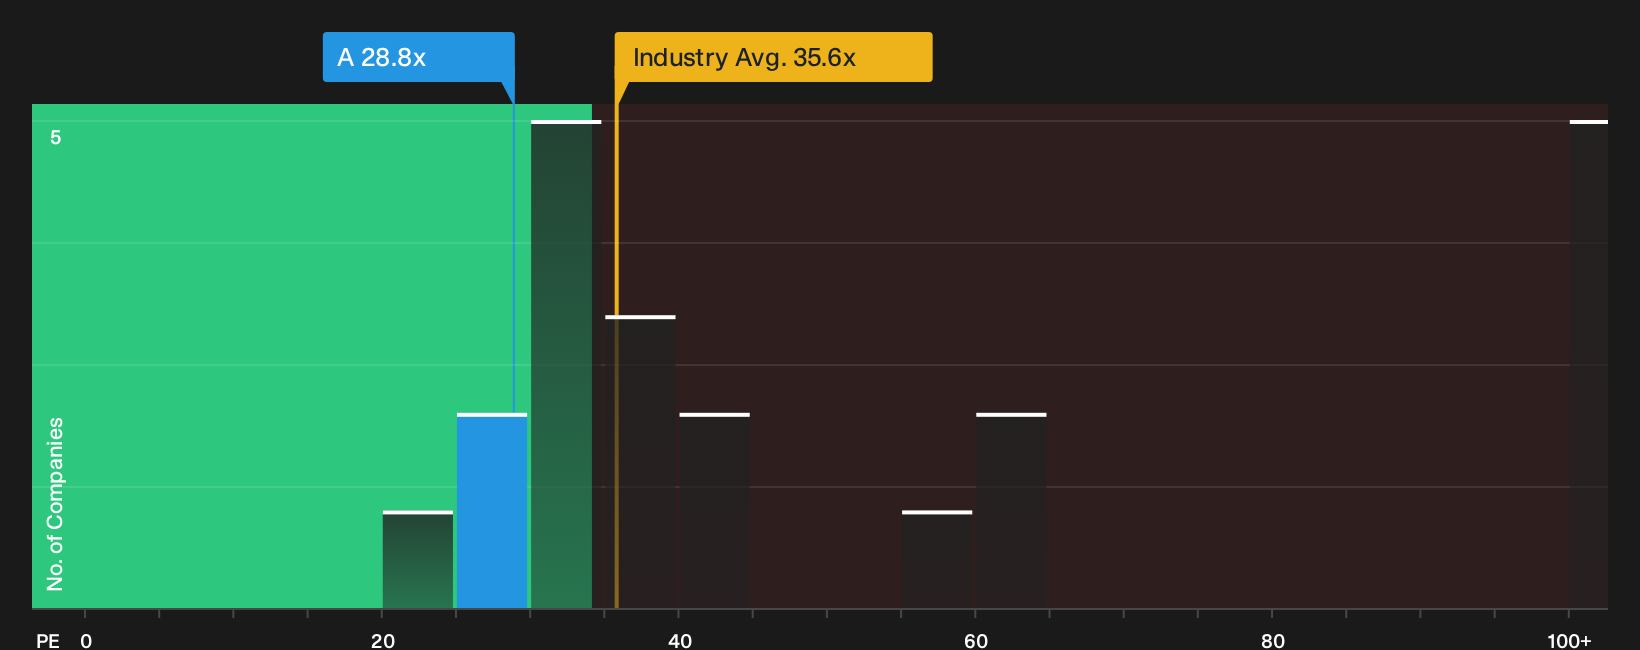
The P/E ratio suits Agilent Technologies because earnings remain a key anchor for how investors weigh established lab equipment businesses. On this measure, the stock trades on about 28.8x earnings, which sits below the Life Sciences industry average near 35.3x and the peer group at roughly 35.2x. That difference suggests the market is not assigning Agilent the same earnings multiple as many listed rivals.
The Fair Ratio model points to a P/E of about 25.9x for Agilent Technologies, which is the level implied by its mix of profitability, size and sector risks. The current 28.8x sits above that mark, so the shares screen as overvalued on this tailored yardstick even if the raw industry comparison looks more forgiving.
On the earnings multiple alone, Agilent Technologies stock comes across as overvalued relative to the Fair Ratio benchmark.
See what the numbers say about this price — find out in our valuation breakdown.
The Agilent Technologies Narrative: What Would Justify Today's Price?
Narratives for Agilent Technologies pick up where the DCF and P/E checks leave off by spelling out the growth, margin and earnings paths that would need to play out for the shares to be worth meaningfully more or less than the current price on Simply Wall St's Community page. Instead of a single valuation number, they set out the future that number assumes, so you can track over time whether Agilent Technologies' actual progress continues to line up with it.
Be one of the first voices in the Simply Wall St community to lay out a numbers driven narrative on Agilent Technologies' valuation, including a view on whether launches like the S540MD slide scanner and Cary 635 FTIR spectrometer really support the current pricing. Put your case on record and track how it holds up as new product adoption and future results come through.
Do you think there's more to the story for Agilent Technologies? Head over to our Community to see what others are saying!
The Bottom Line
Agilent Technologies looks undervalued on a Discounted Cash Flow (DCF) basis, yet the tailored earnings multiple screens as overvalued, so the signals pull in different directions. The split comes from what each lens rewards. The intrinsic value view leans on cash generation and capital needs, while the P/E based check leans on how much optimism the market is pricing into peers. For now, the crux is whether cash flows grow into the current multiple or whether lab spending and product uptake cool enough that the market view proves closer to reality than the intrinsic value estimate.
This article by Simply Wall St is general in nature. We provide commentary based on historical data and analyst forecasts only using an unbiased methodology and our articles are not intended to be financial advice. It does not constitute a recommendation to buy or sell any stock, and does not take account of your objectives, or your financial situation. We aim to bring you long-term focused analysis driven by fundamental data. Note that our analysis may not factor in the latest price-sensitive company announcements or qualitative material. Simply Wall St has no position in any stocks mentioned.
Have feedback on this article? Concerned about the content? Get in touch with us directly. Alternatively, email editorial-team@simplywallst.com