


AMETEK (AME) Q2 Beat Brings Its Valuation Narrative Back Into Focus
AMETEK (AME) moved back into focus after reporting strong Q2 results, featuring double-digit organic sales growth, record orders, a $4.1b backlog, and higher full-year guidance tied to AI, defense, and grid modernization demand.
The Q2 release has come after a bumpy few weeks for AMETEK, with a 30 day share price return down 6.44%. However, the stock has still produced a 15.65% share price gain year to date and a 28.15% total shareholder return over the past year. Recent strength around the $241.87 level, including a 3.26% 1 day share price move and a 6.49% 90 day share price return, suggests that investors are responding to the AI, defense, and grid themes highlighted in the updated outlook while reassessing how much execution risk they are willing to price in.
Scan how other industrial and infrastructure plays are reacting to AI, defense, and grid spending themes by reviewing the curated 39 power grid technology and infrastructure stocks alongside AMETEK's latest move.
That rebound raises a simple question: Are investors now paying up for AMETEK's stronger earnings profile and backlog, or has sentiment simply swung too far after a choppy month, and what does the current valuation say about that balance?
Most Popular Narrative: 13% Undervalued
Against AMETEK's last close at $241.87, the most followed narrative pegs fair value at $277.50, which frames the current earnings strength and backlog as only partly reflected in the price.
EMG and Automation segments are inflecting upwards, with destocking now complete and record orders translating to accelerating organic growth and strong core margin expansion. This shift is poised to further enhance operating leverage and group EBITDA growth in coming quarters.
Want to see what is baked into that $277.50 figure for AMETEK? The narrative leans on steady top line expansion, firmer margins, and a richer future earnings multiple. The interesting part is how those three levers are wired together in the model, and what they assume about the business five years from now.
Result: Fair Value of $277.50 (UNDERVALUED)
Have a read of the narrative in full and understand what's behind the forecasts.
Still, the AMETEK narrative could be knocked off course if process and analytical demand stays soft, or if acquisition heavy growth fails to deliver the expected returns.
Find out about the key risks to this AMETEK narrative.
Another View: AMETEK’s Valuation Through The P/E Lens
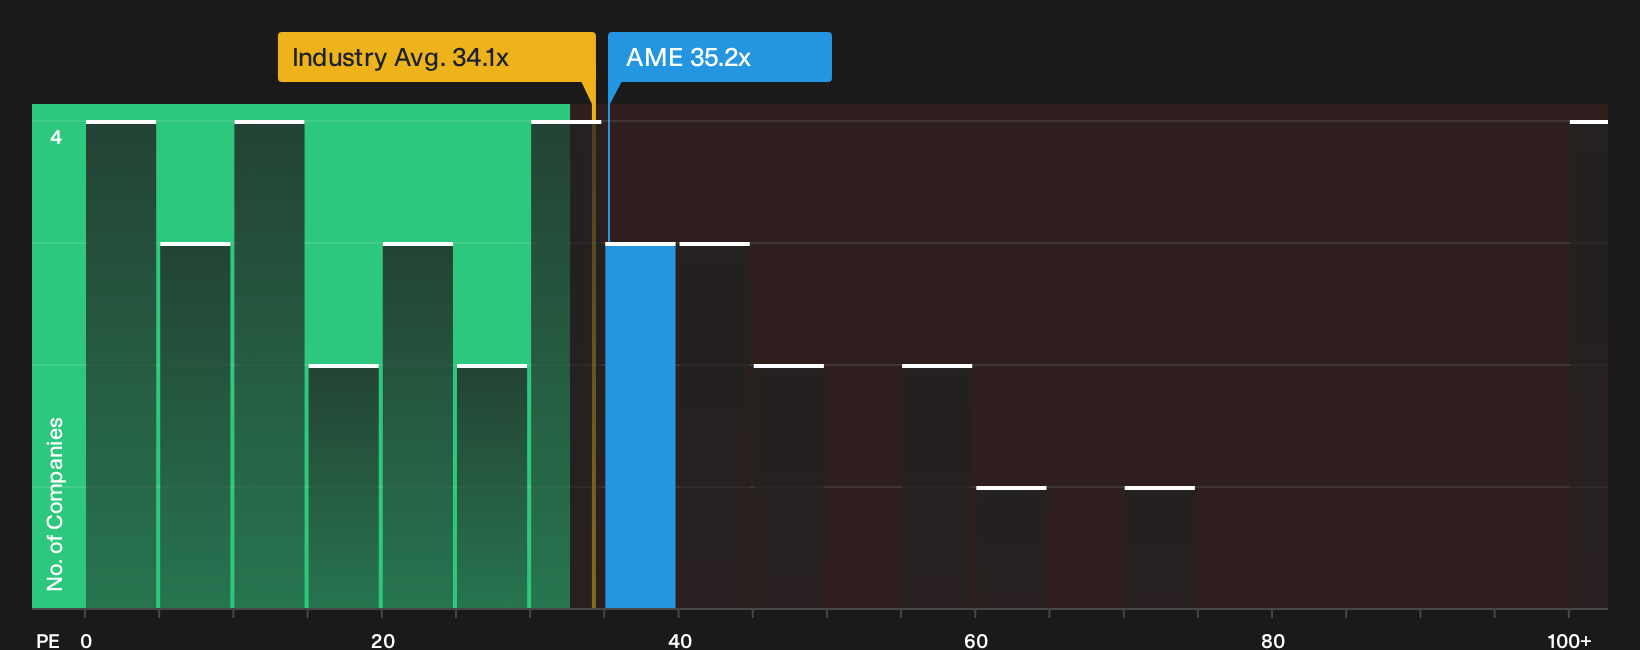
AMETEK may look inexpensive against its $277.50 fair value narrative, but the current P/E of 35.2x tells a tougher story. It sits above the US Electrical industry on 33x and well ahead of a fair ratio of 27.2x, which points to more valuation risk than headroom.
Peers on 39.2x suggest investors are already paying a premium for quality. However, the gap to that 27.2x fair ratio hints at where the multiple could drift if expectations cool. The key consideration is whether AMETEK’s execution can keep that premium intact.
See what the numbers say about this price — find out in our valuation breakdown.
Next Steps
That tension between optimism and valuation risk will not resolve itself. Take a closer look at the underlying drivers, then weigh those 2 key rewards
Looking for more AMETEK style investment ideas?
If AMETEK has sharpened your focus on quality and pricing, do not stop here. Use the Simply Wall Street Screener to widen your opportunity set with ideas built from clear data, not hype.
- Target potential mispricings by reviewing a curated 31 high quality undervalued stocks that filters for quality fundamentals and more modest expectations baked into current prices.
- Strengthen your defensive side by running through a list of solid balance sheet and fundamentals (23 results) that prioritizes cleaner leverage profiles and resilient financial footing.
- Get ahead of the crowd by scanning a focused 16 high quality undiscovered gems that surfaces financially sound businesses still flying under most investors' radar.
This article by Simply Wall St is general in nature. We provide commentary based on historical data and analyst forecasts only using an unbiased methodology and our articles are not intended to be financial advice. It does not constitute a recommendation to buy or sell any stock, and does not take account of your objectives, or your financial situation. We aim to bring you long-term focused analysis driven by fundamental data. Note that our analysis may not factor in the latest price-sensitive company announcements or qualitative material. Simply Wall St has no position in any stocks mentioned.
Have feedback on this article? Concerned about the content? Get in touch with us directly. Alternatively, email editorial-team@simplywallst.com