


Q2 Holdings (QTWO) Stock Looks Cheap Against Fair Value Estimates
Q2 Holdings stock presents a clear split for valuation minded investors, with an intrinsic value estimate pointing to meaningful upside while traditional market multiples suggest the shares are already pricing in a lot of optimism.
- Q2 Holdings has delivered an 86.5% return over the past three years, which puts recent share price weakness into perspective for anyone with a longer holding period.
- The business model is tied closely to recurring software revenue from financial institutions, which can support cash flow visibility, while ongoing investment needs and execution risks around profitability may limit how quickly those cash flows build.
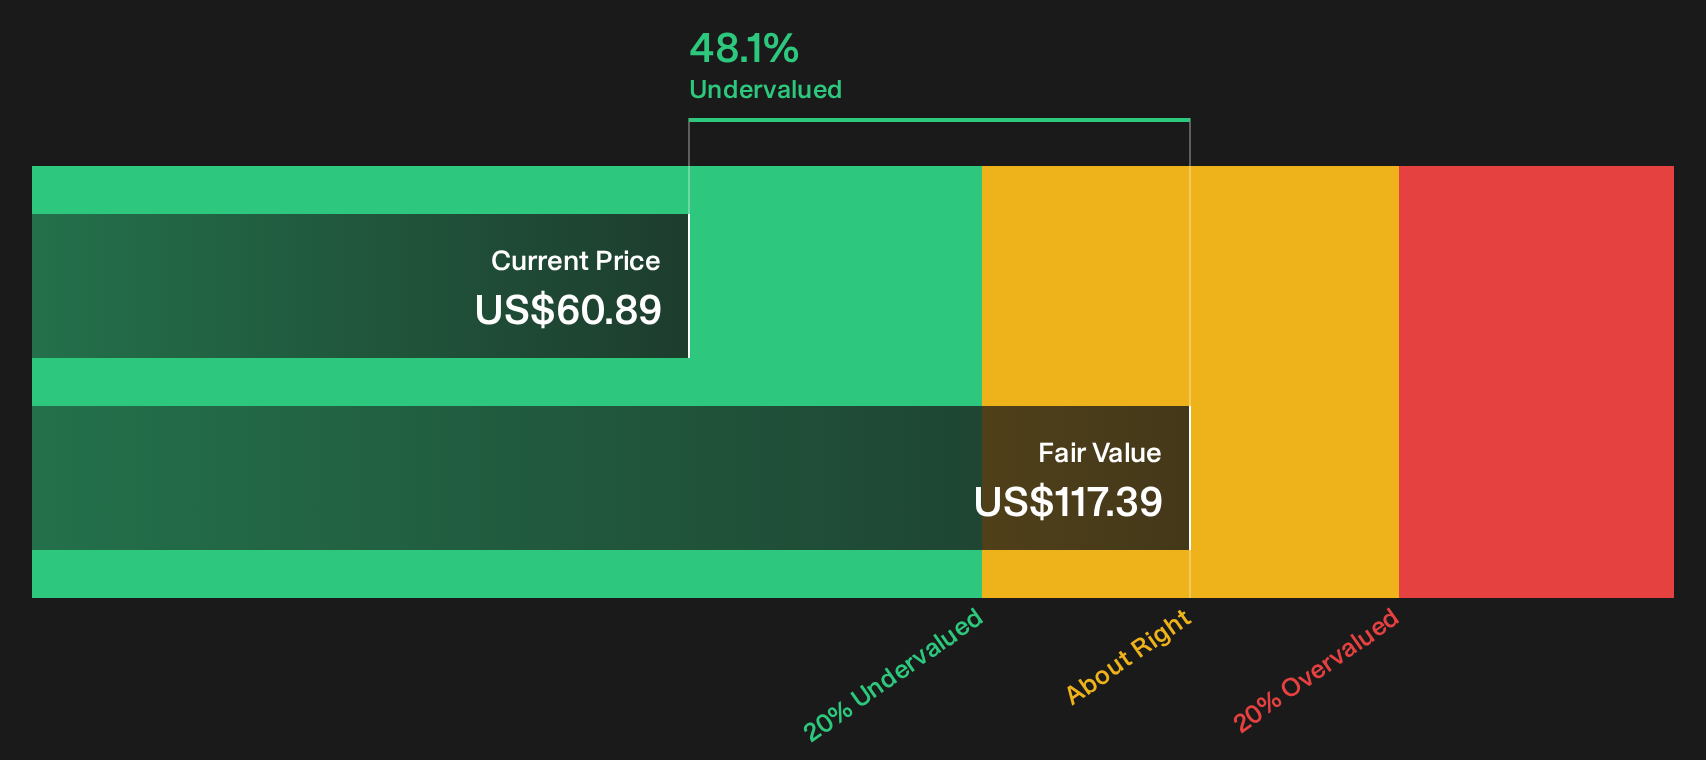
- The broader checks produce a mixed picture rather than a clear bargain or clear overvaluation. The company scores 4 out of 6 on value metrics, and the Discounted Cash Flow intrinsic value estimate sits about 48.1% above the recent share price.
The issue now is whether Q2 Holdings is closer to the lower risk opportunity implied by the intrinsic value estimate or the fuller pricing suggested by its market multiples.
Spot undervalued software plays with recurring revenue profiles similar to Q2 Holdings by scanning our hand picked 31 high quality undervalued stocks.Is Q2 Holdings Still Cheap on Cash Flow?
The Discounted Cash Flow model uses projected cash generation to estimate what Q2 Holdings might be worth today. For this business, the inputs assume growing free cash flow, with the latest twelve month figure at about $191.2 million and analyst projections pointing to higher levels later in the decade.
On those assumptions, the model arrives at an intrinsic value of about $117 per share in dollar terms. Compared with the current share price, that implies Q2 Holdings is trading at roughly a 48.1% discount to the cash flows embedded in this 2 Stage Free Cash Flow to Equity model.
On this DCF view, Q2 Holdings stock appears undervalued relative to its projected cash generation.
Our Discounted Cash Flow (DCF) analysis suggests Q2 Holdings is undervalued by 48.1%. Track this in your watchlist or portfolio, or discover 31 more high quality undervalued stocks.
Has Q2 Holdings Run Too Far on Earnings?
P/E fits Q2 Holdings because investors tend to anchor on earnings-based metrics for established software platforms with clear customer bases.
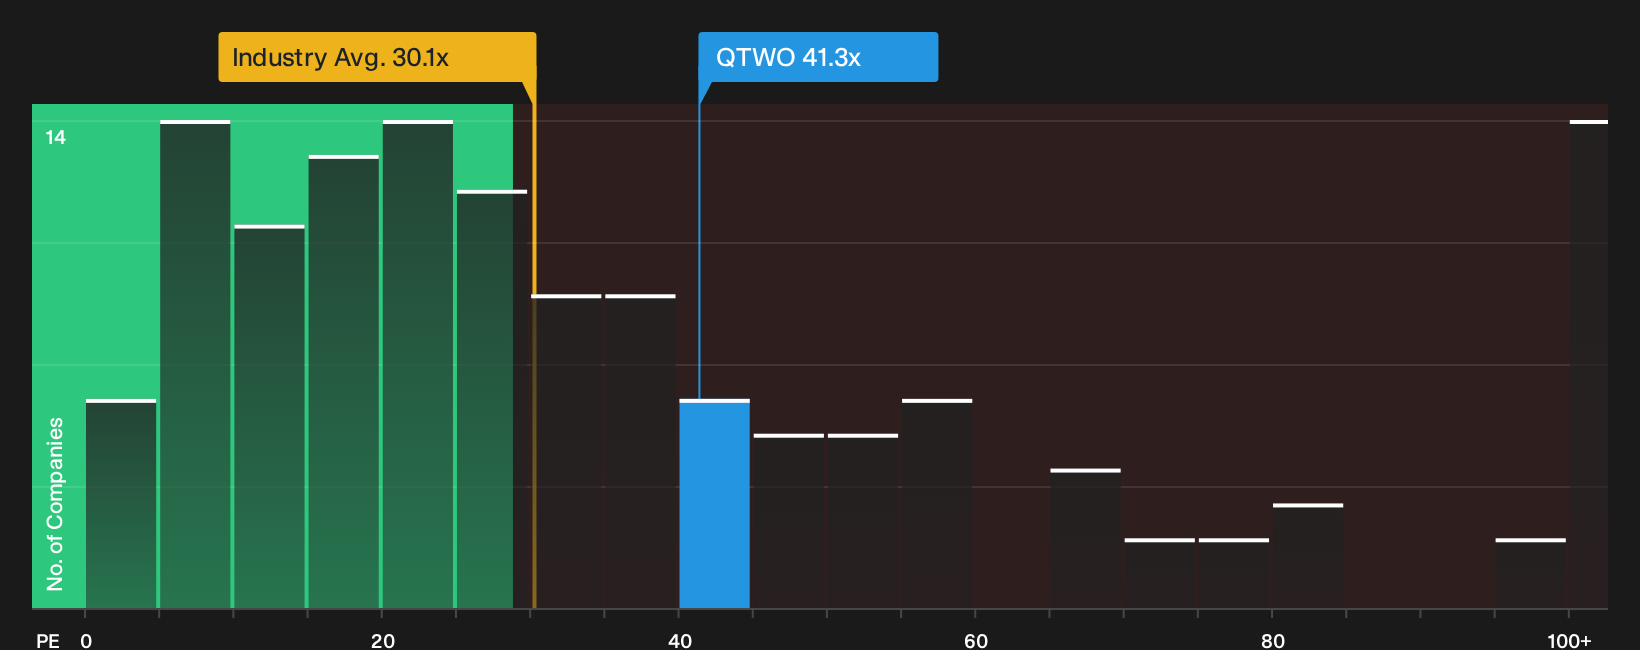
The stock trades on a P/E of about 41.3x, above the broader Software industry average of roughly 30.1x. Against peers tracked in this framework, where the average sits near 66.0x, Q2 Holdings lands somewhere in the middle rather than at an extreme. The model-based fair P/E ratio, which blends in the company’s growth profile, profitability, scale and risk, is about 30.9x. That leaves a gap of roughly 10 multiple turns between where the shares change hands and where this approach would flag a more balanced price.
For anyone weighing the intrinsic value work against the earnings multiple, that premium suggests the market is already paying up for Q2 Holdings on reported profit.
On the P/E yardstick, Q2 Holdings looks overvalued relative to the level of earnings the model treats as a fair anchor.
See what the numbers say about this price — find out in our valuation breakdown.
The Q2 Holdings Narrative: What Would Justify Today's Price?
Simply Wall St Narratives for Q2 Holdings give you a structured way to connect the valuation gap above with concrete expectations about Q2 Holdings' future growth, margins and earnings. Each scenario links a fair value estimate to a clear storyline around potential catalysts and key risks, so you can track over time which version of events appears closest to how the business actually develops on the Community page.
Add your own narrative on Q2 Holdings' valuation trade-off and set out a clear, number-driven view on where its growth, margins and execution go from here.
Share your thesis so other investors can see how Q2 Holdings' story matches the figures as fresh results arrive and new data feeds into the models.
Do you think there's more to the story for Q2 Holdings? Head over to our Community to see what others are saying!
The Bottom Line
Q2 Holdings screens as undervalued on a Discounted Cash Flow (DCF) basis, while the earnings multiple points to an overvalued stock on reported profit. That split comes down to which lens you trust more: the long runway of potential cash generation, or today’s P/E that already bakes in a healthy dose of optimism. With the broader checks landing in mixed territory, the real swing factor is whether Q2 Holdings can translate its recurring software revenue into sustained, higher margin cash flows fast enough to justify paying up on earnings today.
This article by Simply Wall St is general in nature. We provide commentary based on historical data and analyst forecasts only using an unbiased methodology and our articles are not intended to be financial advice. It does not constitute a recommendation to buy or sell any stock, and does not take account of your objectives, or your financial situation. We aim to bring you long-term focused analysis driven by fundamental data. Note that our analysis may not factor in the latest price-sensitive company announcements or qualitative material. Simply Wall St has no position in any stocks mentioned.
Have feedback on this article? Concerned about the content? Get in touch with us directly. Alternatively, email editorial-team@simplywallst.com