


JACCS (TSE:8584) Restructures Credit Screening As Valuation Questions Come Into View
JACCS (TSE:8584) has moved into focus after its board approved a wide credit screening reorganization, including consolidating operations to seven hubs and introducing workforce rationalization at four regional locations.
For context, JACCS shares trade at ¥3,730 after a 1-day share price return of 1.08%. However, the year-to-date share price return is down 13.66%, and the 1-year total shareholder return has declined 10.93%. This hints that enthusiasm around the restructuring and recent board-level changes is still cautious and that momentum has been fading over the past year, despite a 4.48% 90-day share price gain and a 49.76% total shareholder return over five years.
Capitalize on the restructuring theme at JACCS by scanning a hand picked list of solid balance sheet and fundamentals (19 results).JACCS now trades below one intrinsic value estimate, yet sits above the average analyst target after this restructuring push. Is the market discounting real operational risk, or undervaluing a cleaner, leaner balance of costs and scale?
Price-to-Earnings of 11.1x: Is it justified?
On simple earnings terms, JACCS changes hands at a P/E of 11.1x, which places the ¥3,730 share price in a modest value bracket rather than an aggressive one.
The P/E ratio compares the current share price to annual earnings per share, so a higher figure often reflects stronger growth expectations or a market willing to pay up for quality. For a consumer finance player like JACCS, which operates installment credit, card services, and guarantees, this measure gives a quick read on how much investors are paying for each unit of profit.
Here, the stock appears cheaper than the wider Asian Consumer Finance industry, where the average P/E is 12.1x. This suggests the market is not attaching a premium to its earnings profile. However, compared to a closer peer set on a 10.6x average P/E, the valuation is slightly richer, which points to a narrow pricing gap that could close if sentiment or results shift.
The fair P/E estimate from Simply Wall St’s modelling sits at 11.8x, which is above the current 11.1x and indicates the multiple may move closer to that level if the market aligns more tightly with those inputs.
Explore the SWS fair ratio for JACCS.
Result: Preferred multiple of Price-to-Earnings of 11.1x (UNDERVALUED)
Still, the restructuring story at JACCS carries real execution risk, especially if workforce cuts disrupt credit screening quality or if overseas operations fail to pull their weight.
Find out about the key risks to this JACCS narrative.
Another View on JACCS Using Cash Flows
While earnings multiples hint at JACCS being modestly cheap, the SWS DCF model presents an even stronger picture. At ¥3,730 versus an estimated future cash flow value of ¥4,982.63, the stock screens as undervalued on cash generation. Which lens do you trust more when restructuring risk is front and center?
For a closer look at how this cash flow view is built and where the assumptions could prove too harsh or too generous, Look into how the SWS DCF model arrives at its fair value..
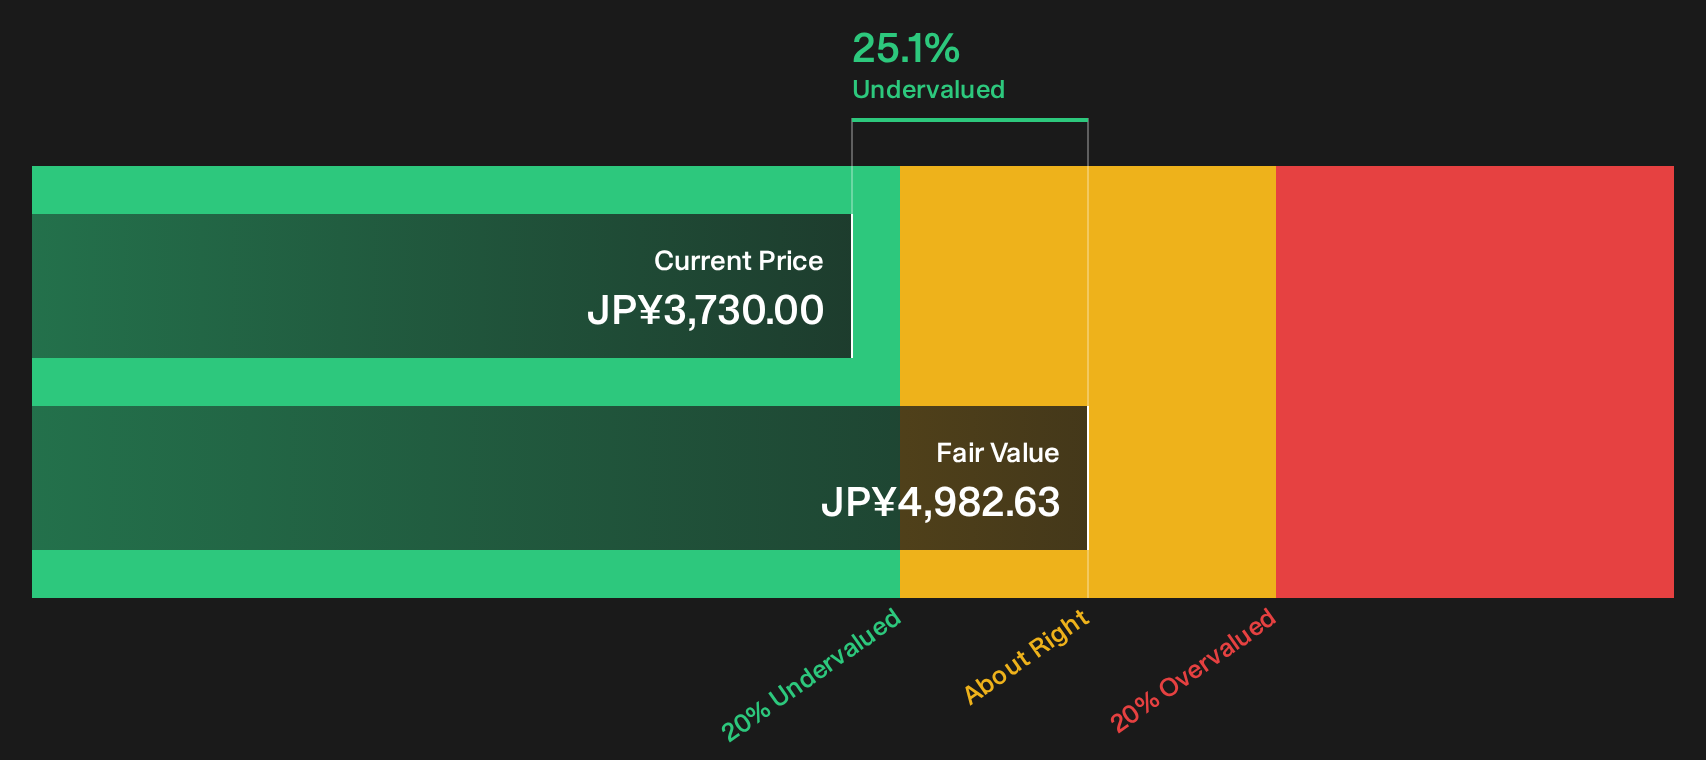
Simply Wall St performs a discounted cash flow (DCF) on every stock in the world every day (check out JACCS for example). We show the entire calculation in full. You can track the result in your watchlist or portfolio and be alerted when this changes, or use our stock screener to discover 16 high quality undervalued stocks. If you save a screener we even alert you when new companies match - so you never miss a potential opportunity.
Next Steps
Curious whether the mixed tone around JACCS really fits the numbers? Take a closer look yourself and consider both sides of the story by reviewing the 2 key rewards and 3 important warning signs.
Want more ideas beyond JACCS?
Do not stop with one opportunity. Broaden your watchlist with fresh ideas that match your risk appetite and income goals using the Simply Wall St screener tools.
- Target potential mispriced businesses by scanning a 16 high quality undervalued stocks that combine quality fundamentals with attractive valuations.
- Lock in potential income streams by reviewing a 19 dividend fortresses built around higher-yielding payers.
- Dial down volatility by focusing on a 10 resilient stocks with low risk scores where balance sheets and risk scores aim to keep surprises in check.
This article by Simply Wall St is general in nature. We provide commentary based on historical data and analyst forecasts only using an unbiased methodology and our articles are not intended to be financial advice. It does not constitute a recommendation to buy or sell any stock, and does not take account of your objectives, or your financial situation. We aim to bring you long-term focused analysis driven by fundamental data. Note that our analysis may not factor in the latest price-sensitive company announcements or qualitative material. Simply Wall St has no position in any stocks mentioned.
Have feedback on this article? Concerned about the content? Get in touch with us directly. Alternatively, email editorial-team@simplywallst.com