


3 Stocks That May Be Trading Below Their Estimated Value In September 2026
Over the past 7 days, the United States market has experienced a 2.2% decline, though it remains up by 13% over the last year with anticipated earnings growth of 17% per annum in the coming years. In this context, identifying stocks that may be trading below their estimated value can provide investors with opportunities to capitalize on potential future gains while navigating current market fluctuations.
Top 10 Undervalued Stocks Based On Cash Flows In The United States
| Name | Current Price | Fair Value (Est) | Discount (Est) |
| Valley National Bancorp (VLY) | $13.85 | $27.10 | 48.9% |
| Pegasystems (PEGA) | $35.72 | $70.66 | 49.4% |
| Old National Bancorp (ONB) | $25.60 | $51.00 | 49.8% |
| Northeast Bank (NBN) | $131.22 | $246.98 | 46.9% |
| Futu Holdings (FUTU) | $113.51 | $211.32 | 46.3% |
| Civista Bancshares (CIVB) | $27.35 | $53.11 | 48.5% |
| Capital Bancorp (CBNK) | $36.36 | $66.80 | 45.6% |
| Autodesk (ADSK) | $211.61 | $413.81 | 48.9% |
| Alliance Entertainment Holding (AENT) | $5.51 | $10.53 | 47.7% |
| Addus HomeCare (ADUS) | $118.52 | $226.18 | 47.6% |
We'll examine a selection from our screener results.
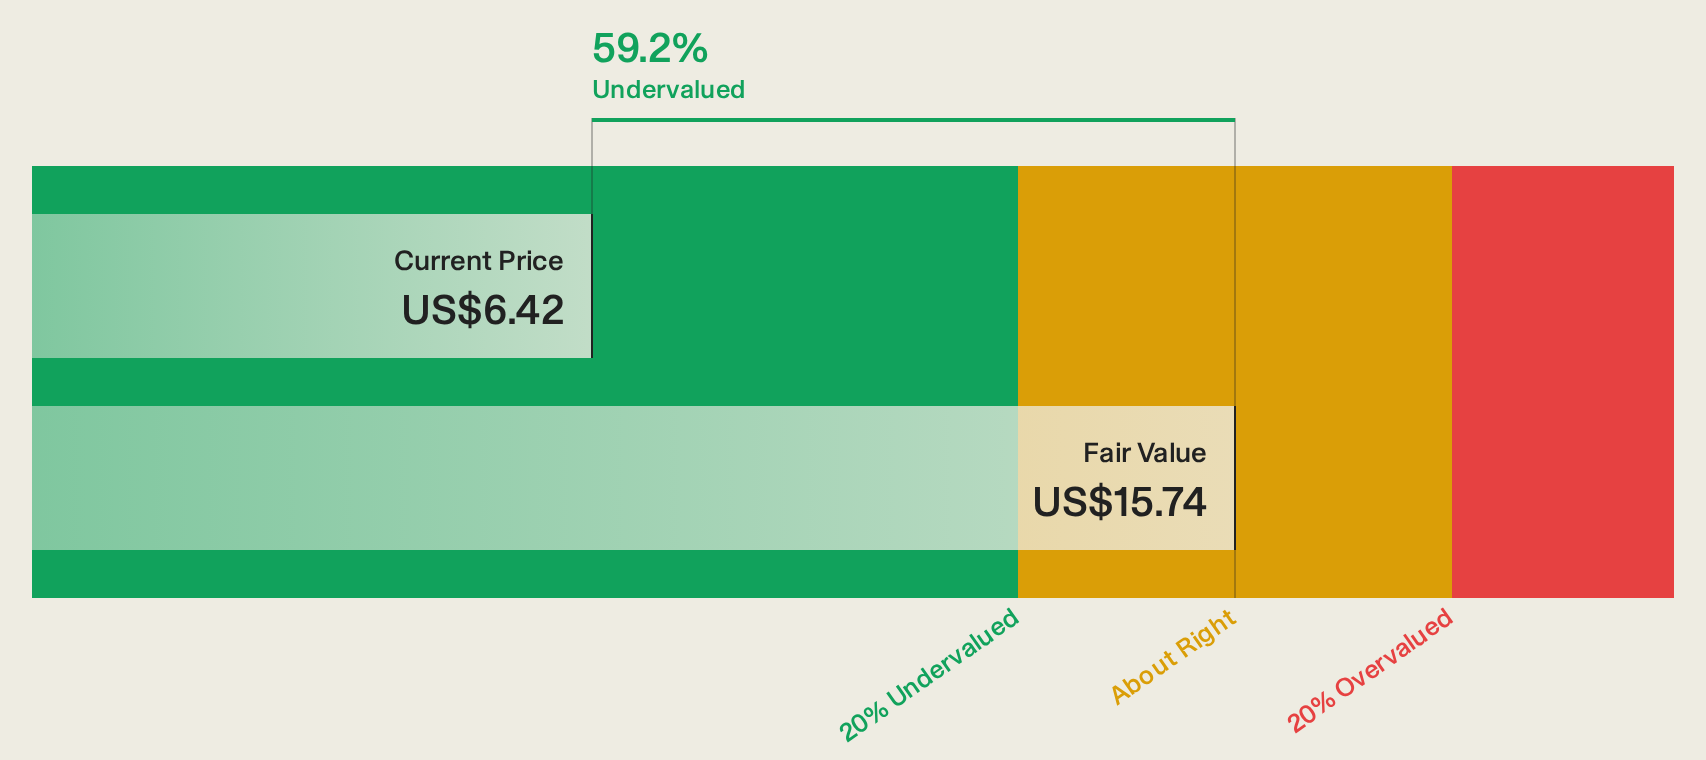
Alliance Entertainment Holding (AENT)
Overview: Alliance Entertainment Holding Corporation operates as a wholesaler and e-commerce provider for the entertainment industry worldwide, with a market cap of approximately $270.17 million.
Operations: The company's revenue segment includes wholesale miscellaneous, generating $1.11 billion.
Estimated Discount To Fair Value: 47.7%
Alliance Entertainment Holding is trading at US$5.51, significantly below its estimated future cash flow value of US$10.53, highlighting potential undervaluation based on cash flows. Despite this, the company faces challenges with high debt levels and forecasts indicating a decline in earnings by 9.2% annually over the next three years. Recent full-year results showed a slight increase in sales to US$1.15 billion but a decrease in net income to US$13.06 million compared to last year.
- Our expertly prepared growth report on Alliance Entertainment Holding implies its future financial outlook may be stronger than recent results.
- Get an in-depth perspective on Alliance Entertainment Holding's balance sheet by reading our health report here.
Ituran Location and Control (ITRN)
Overview: Ituran Location and Control Ltd. offers location-based telematics services and machine-to-machine telematics products in Israel, Brazil, and internationally, with a market cap of $1.02 billion.
Operations: The company generates revenue from two main segments: $99.38 million from telematics products and $293.85 million from telematics services.
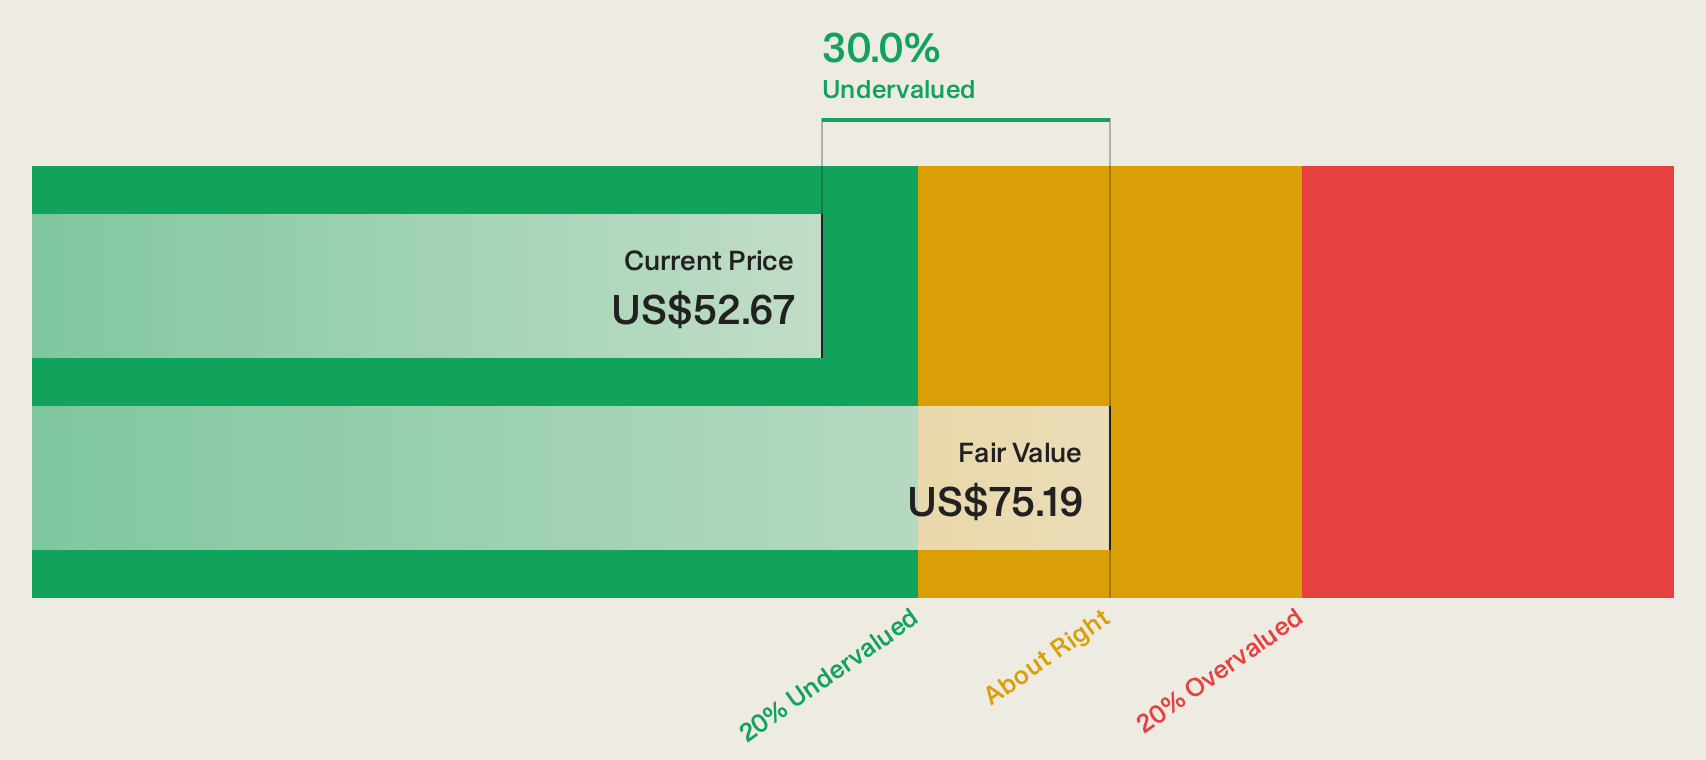
Estimated Discount To Fair Value: 31.1%
Ituran Location and Control is trading at US$51.75, below its estimated future cash flow value of US$75.13, suggesting undervaluation based on cash flows. Recent earnings reports show revenue growth to US$104.79 million for Q2 2026, with net income rising to US$17.33 million from the previous year. The company secured a lucrative contract with Israel's Ministry of Transport and continues shareholder returns through dividends and share buybacks totaling over $28 million since 2021.
- According our earnings growth report, there's an indication that Ituran Location and Control might be ready to expand.
- Click here to discover the nuances of Ituran Location and Control with our detailed financial health report.
Inspire Medical Systems (INSP)
Overview: Inspire Medical Systems, Inc. is a medical technology company that develops and commercializes minimally invasive solutions for obstructive sleep apnea (OSA) patients globally, with a market cap of approximately $1.92 billion.
Operations: The company's revenue is primarily generated from its patient monitoring equipment segment, which accounts for $898.74 million.
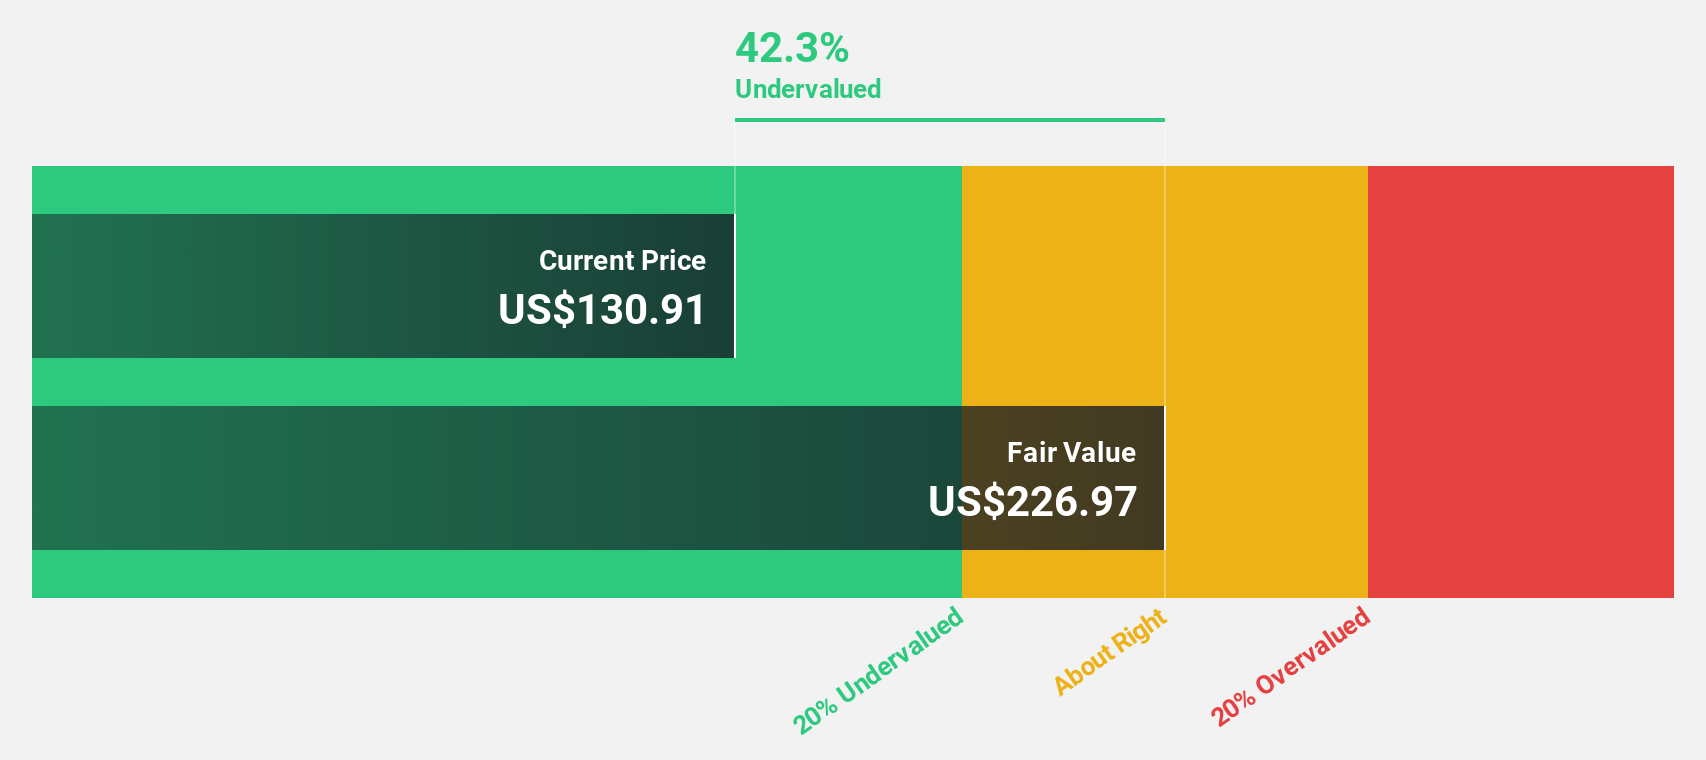
Estimated Discount To Fair Value: 21.7%
Inspire Medical Systems, trading at US$68.12, is undervalued based on its future cash flow value of US$87.03. Despite a forecasted earnings decline of 9% annually over the next three years, recent Q2 results showed a turnaround with net income reaching US$0.314 million from a loss last year. The company raised its 2026 revenue outlook to between $835 million and $875 million and remains competitively priced relative to industry peers despite slower expected revenue growth than the broader market.
- The analysis detailed in our Inspire Medical Systems growth report hints at robust future financial performance.
- Delve into the full analysis health report here for a deeper understanding of Inspire Medical Systems.
Next Steps
- Investigate our full lineup of 51 Undervalued US Stocks Based On Cash Flows right here.
- Are any of these part of your asset mix? Tap into the analytical power of Simply Wall St's portfolio to get a 360-degree view on how they're shaping up.
- Join a community of smart investors by using Simply Wall St. It's free and delivers expert-level analysis on worldwide markets.
Looking For Alternative Opportunities?
- Explore high-performing small cap companies that haven't yet garnered significant analyst attention.
- Diversify your portfolio with solid dividend payers offering reliable income streams to weather potential market turbulence.
- Fuel your portfolio with companies showing strong growth potential, backed by optimistic outlooks both from analysts and management.
This article by Simply Wall St is general in nature. We provide commentary based on historical data and analyst forecasts only using an unbiased methodology and our articles are not intended to be financial advice. It does not constitute a recommendation to buy or sell any stock, and does not take account of your objectives, or your financial situation. We aim to bring you long-term focused analysis driven by fundamental data. Note that our analysis may not factor in the latest price-sensitive company announcements or qualitative material. Simply Wall St has no position in any stocks mentioned.
Have feedback on this article? Concerned about the content? Get in touch with us directly. Alternatively, email editorial-team@simplywallst.com