


European Equities Trading Below Estimated Value In September 2026
In September 2026, European equities experienced a challenging period as rising energy prices and geopolitical tensions weighed on investor sentiment, with the pan-European STOXX Europe 600 Index ending the week down. Despite these pressures, opportunities may exist in stocks trading below their estimated value, offering potential for growth as market conditions stabilize and rate concerns moderate.
Top 10 Undervalued Stocks Based On Cash Flows In Europe
| Name | Current Price | Fair Value (Est) | Discount (Est) |
| Sulzer (SWX:SUN) | CHF150.80 | CHF288.20 | 47.7% |
| Promotica (BIT:PMT) | €3.06 | €5.89 | 48% |
| Marimekko Oyj (HLSE:MEKKO) | €9.10 | €16.82 | 45.9% |
| KSB SE KGaA (XTRA:KSB) | €948.00 | €1758.58 | 46.1% |
| Kalmar Oyj (HLSE:KALMAR) | €39.48 | €65.59 | 39.8% |
| Frequentis (XTRA:FQT) | €66.70 | €114.60 | 41.8% |
| Embla Medical hf (CPSE:EMBLA) | DKK27.70 | DKK46.44 | 40.4% |
| CombinedX (OM:CX) | SEK39.60 | SEK78.50 | 49.6% |
| Boliden (OM:BOL) | SEK546.80 | SEK1011.40 | 45.9% |
| Apator (WSE:APT) | PLN27.00 | PLN49.19 | 45.1% |
Underneath we present a selection of stocks filtered out by our screen.
Telefonaktiebolaget LM Ericsson (OM:ERIC B)
Overview: Telefonaktiebolaget LM Ericsson (publ) offers mobile connectivity solutions to communications service providers, enterprises, and the public sector across multiple regions including the Americas, Europe, and Asia, with a market cap of approximately SEK319.40 billion.
Operations: The company's revenue segments include Networks at SEK145.61 billion, Enterprise at SEK18.29 billion, and Cloud Software and Services at SEK61.94 billion.
Estimated Discount To Fair Value: 25.9%
Telefonaktiebolaget LM Ericsson appears undervalued, trading at SEK 97.24 against a future cash flow value estimate of SEK 131.24, representing a significant discount. Despite this, earnings are projected to decline by an average of 3.1% annually over the next three years, and revenue growth is expected to be modest at 0.7% per year. Recent strategic collaborations with AT&T and Tampa Electric highlight Ericsson's robust role in advancing network capabilities and infrastructure development across critical sectors.
- Our comprehensive growth report raises the possibility that Telefonaktiebolaget LM Ericsson is poised for substantial financial growth.
- Click to explore a detailed breakdown of our findings in Telefonaktiebolaget LM Ericsson's balance sheet health report.
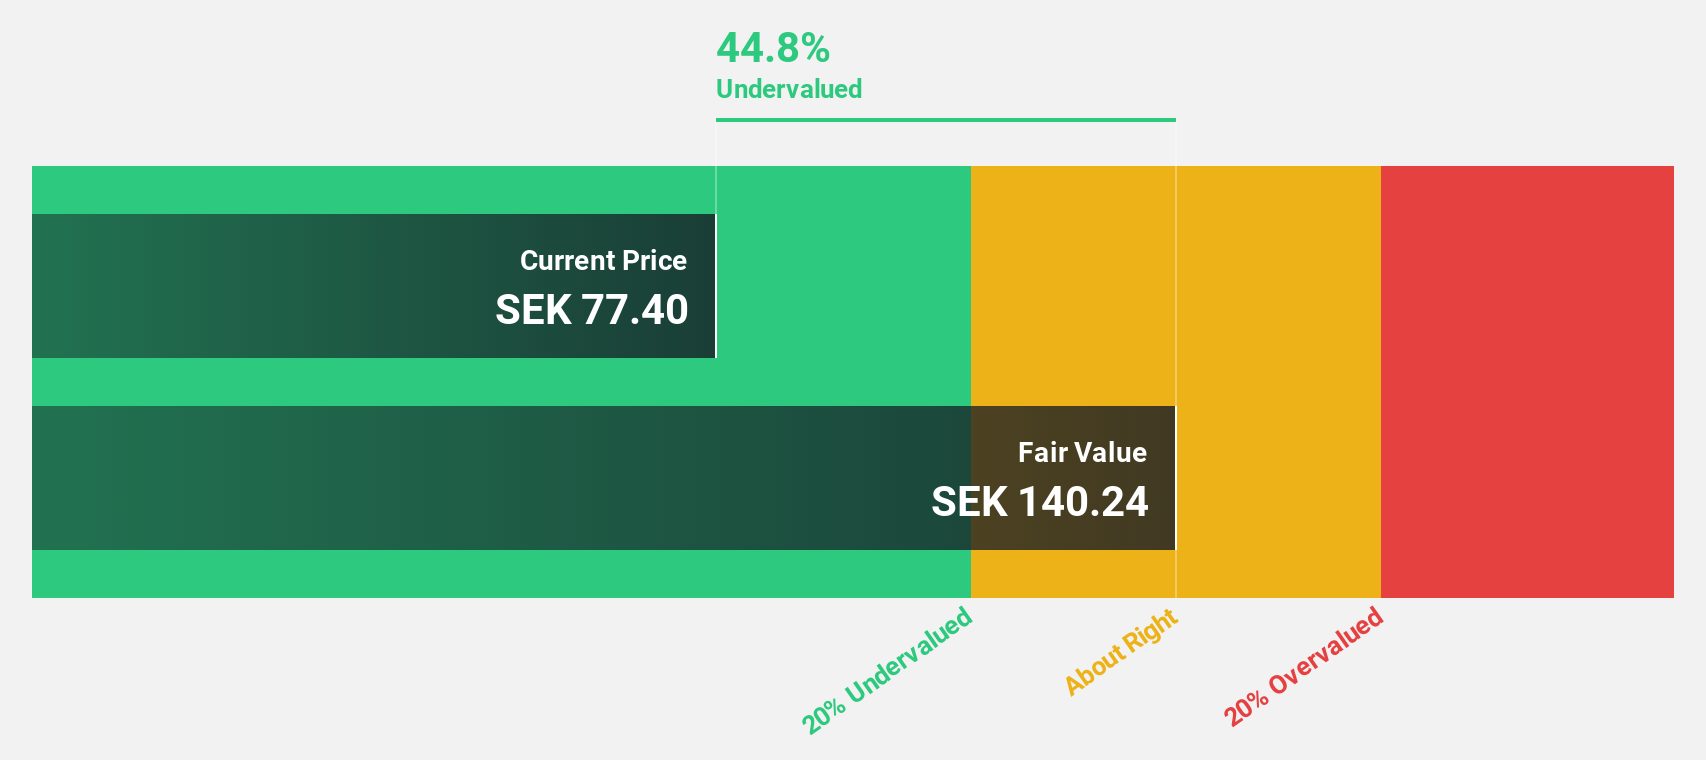
Synektik Spólka Akcyjna (WSE:SNT)
Overview: Synektik Spólka Akcyjna offers products, services, and IT solutions for surgery, diagnostic imaging, and nuclear medicine applications in Poland with a market cap of PLN2.87 billion.
Operations: The company's revenue segments include PLN889.20 million from Diagnostic and IT Equipment and PLN55.61 million from the Production of Radio Pharmaceuticals.
Estimated Discount To Fair Value: 29.2%
Synektik Spólka Akcyjna is trading at PLN 336.4, below its estimated future cash flow value of PLN 475.37, indicating it is undervalued by over 29%. Despite this, earnings are forecast to decline by 25.3% annually over the next three years, though revenue is expected to grow at a rate of 5.7% per year, outpacing the Polish market's growth rate of 4.8%. Recent earnings reports show significant profit increases with net income reaching PLN 386.41 million for nine months ended June 30, 2026.
- Our earnings growth report unveils the potential for significant increases in Synektik Spólka Akcyjna's future results.
- Get an in-depth perspective on Synektik Spólka Akcyjna's balance sheet by reading our health report here.
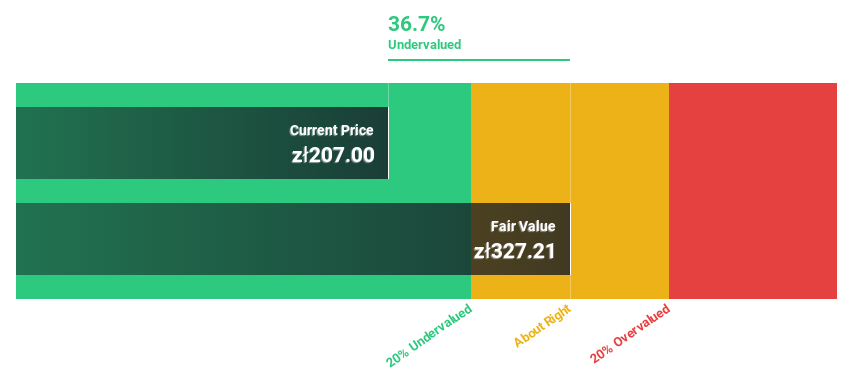
KSB SE KGaA (XTRA:KSB)
Overview: KSB SE & Co. KGaA, along with its subsidiaries, operates globally by supplying pumps, valves, and related services, with a market capitalization of €1.57 billion.
Operations: The company generates revenue through its segments, with Pumps contributing €1.64 billion, Valves accounting for €399 million, and KSB Supremeserv bringing in €1.00 billion.
Estimated Discount To Fair Value: 46.1%
KSB SE KGaA is trading at €948, significantly below its estimated future cash flow value of €1,758.58, suggesting strong undervaluation. However, recent earnings show a decline in net income to €48 million for the half year ended June 30, 2026. Despite an 11.4% profit growth over the past year and good relative value compared to peers, projected annual earnings and revenue growth remain below market averages at 9.9% and 4.4%, respectively.
- The analysis detailed in our KSB SE KGaA growth report hints at robust future financial performance.
- Click here and access our complete balance sheet health report to understand the dynamics of KSB SE KGaA.

Seize The Opportunity
- Click this link to deep-dive into the 19 companies within our Undervalued European Stocks Based On Cash Flows screener.
- Have a stake in these businesses? Integrate your holdings into Simply Wall St's portfolio for notifications and detailed stock reports.
- Take control of your financial future using Simply Wall St, offering free, in-depth knowledge of international markets to every investor.
Ready For A Different Approach?
- Explore high-performing small cap companies that haven't yet garnered significant analyst attention.
- Diversify your portfolio with solid dividend payers offering reliable income streams to weather potential market turbulence.
- Fuel your portfolio with companies showing strong growth potential, backed by optimistic outlooks both from analysts and management.
This article by Simply Wall St is general in nature. We provide commentary based on historical data and analyst forecasts only using an unbiased methodology and our articles are not intended to be financial advice. It does not constitute a recommendation to buy or sell any stock, and does not take account of your objectives, or your financial situation. We aim to bring you long-term focused analysis driven by fundamental data. Note that our analysis may not factor in the latest price-sensitive company announcements or qualitative material. Simply Wall St has no position in any stocks mentioned.
Have feedback on this article? Concerned about the content? Get in touch with us directly. Alternatively, email editorial-team@simplywallst.com