


Autodesk (ADSK) Stock Looks Undervalued While Earnings Concerns Keep It Cheap
Autodesk stock has dropped sharply over the past year, yet both an intrinsic value estimate based on Discounted Cash Flow (DCF) and market multiples currently point to the shares trading at a discount to what the business may be worth.
- Over the past 12 months Autodesk is down about 33%, which means recent sellers have already absorbed a significant pullback.
- Recent earnings strength combined with concerns about profit expectations has created a gap between what the market is willing to pay today and what future cash flows may support.
- Across a broad set of valuation checks Autodesk screens as cheap, with a high value score of 6 and both the DCF intrinsic value estimate and earnings multiples pointing to undervaluation.
The issue now is whether that apparent discount offers a reasonable entry point or reflects risks to Autodesk's earnings power that the current models do not fully capture.
Compare Autodesk's pullback with other potential value setups by scanning 49 high quality undervalued stocks, focusing on stocks that have also experienced sharp share price declines while still screening as fundamentally strong.
Is Autodesk a Bargain on Cash Flow?
The Discounted Cash Flow (DCF) approach values Autodesk on the cash it is expected to generate for shareholders over time. The model uses latest twelve month free cash flow of about $2.80b and then assumes that Autodesk keeps growing those cash flows rather than shrinking them.
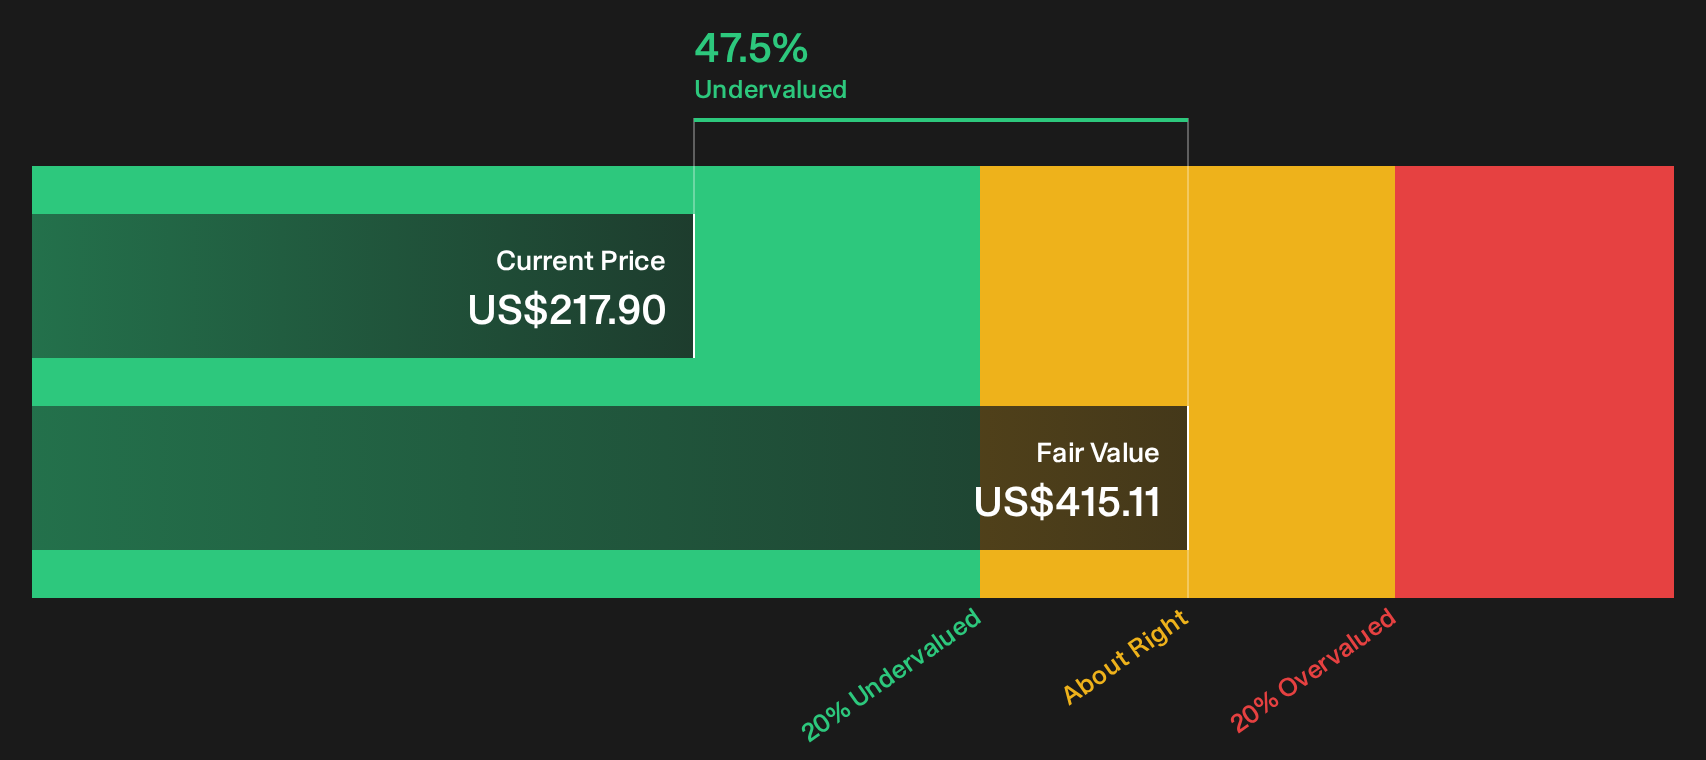
On those projections, the DCF model arrives at an estimated intrinsic value of about $415 per share, which is well above where the stock trades today. The calculation implies the shares are roughly 47.5% undervalued relative to those projected cash flows. Autodesk’s recent earnings beat but softer profit outlook help explain why the market price remains below this cash flow based estimate.
On this Discounted Cash Flow view, Autodesk stock currently screens as undervalued relative to the cash the business is expected to generate.
Our Discounted Cash Flow (DCF) analysis suggests Autodesk is undervalued by 47.5%. Track this in your watchlist or portfolio, or discover 49 more high quality undervalued stocks.
Is Autodesk Still Cheap on Earnings?
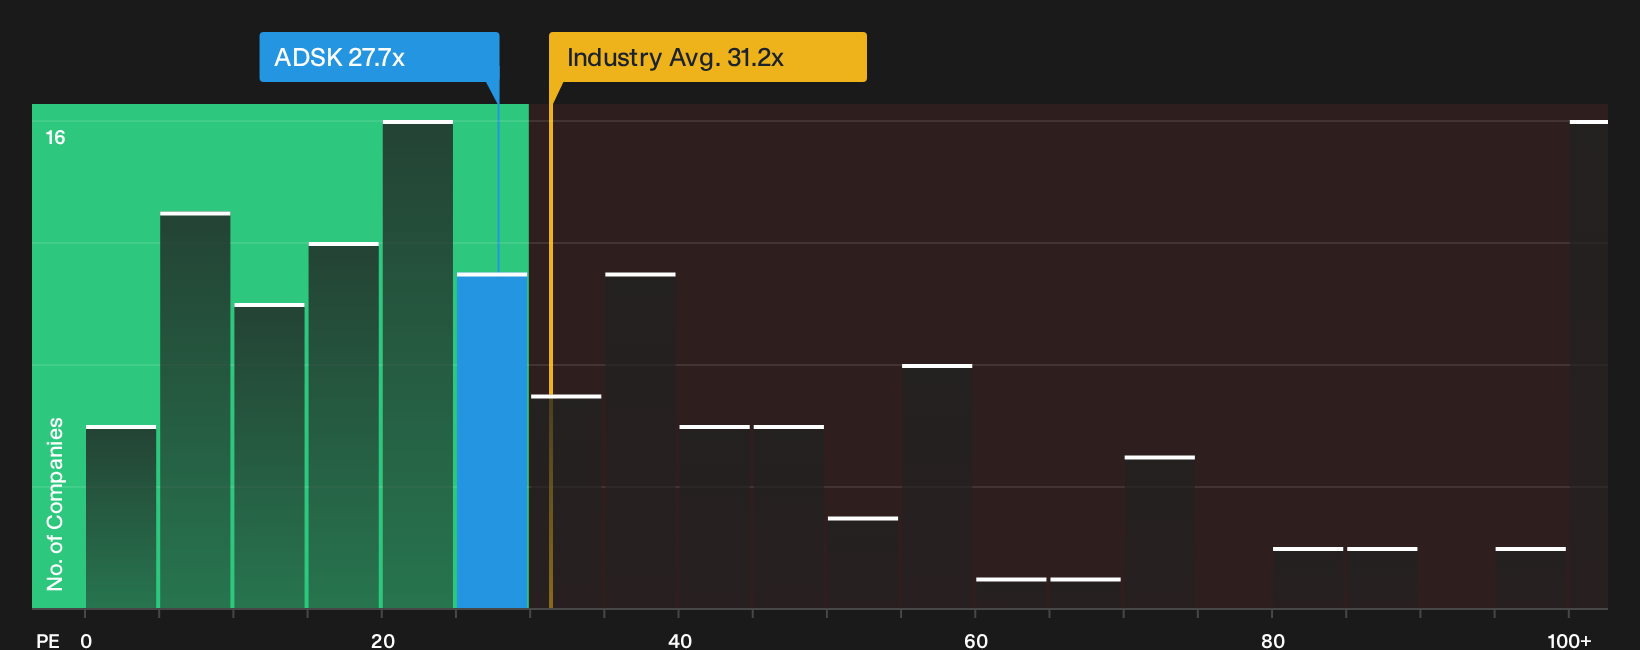
The P/E ratio works well for Autodesk because earnings are a central focus for both management and investors. On this metric, the stock trades at about 27.7x current earnings. That sits below the broader software industry on roughly 31.2x and well under the peer group average of about 45.6x, which points to a relatively cautious price tag on Autodesk’s profit stream.
A more tailored yardstick is the modelled fair P/E of about 32.6x, which blends Autodesk’s sector, size, margins and risk profile into a single benchmark. The current 27.7x level is meaningfully lower than that fair ratio. This suggests the market is applying a discount to Autodesk compared with what those fundamentals might support.
On the P/E lens, Autodesk stock appears undervalued relative to both its industry peers and the fair multiple implied by its fundamentals.
See what the numbers say about this price — find out in our valuation breakdown.
The Autodesk Narrative: What Would Justify Today's Price?
Autodesk Narratives on Simply Wall St pick up where the valuation gap leaves off. They spell out which paths for growth, profitability and earnings would need to play out for the stock to be worth substantially more or less than the current market price. Each one treats its fair value as a thesis about Autodesk's business that can be checked over time rather than a static snapshot.
One of the top community narratives on Autodesk: 7% undervalued
"Autodesk is investing heavily in cloud platforms, AI and consumption based models, but monetization is described as a multiyear journey…"
Read one of the top narratives on Autodesk
Do you think there's more to the story for Autodesk? Head over to our Community to see what others are saying!
The Bottom Line
Autodesk screens as undervalued on both the Discounted Cash Flow (DCF) intrinsic value estimate and current earnings multiples, which points to a genuine pricing gap rather than a quirk of one model. That sets up a straightforward question for investors. The key is whether Autodesk can convert its product and platform investments into durable cash generation that aligns with what the DCF and fair P/E assume. If that earnings power holds up, the current discount could appear attractive, but if profit delivery or monetization lags, the lower valuation may simply reflect the market already accounting for those risks.
This article by Simply Wall St is general in nature. We provide commentary based on historical data and analyst forecasts only using an unbiased methodology and our articles are not intended to be financial advice. It does not constitute a recommendation to buy or sell any stock, and does not take account of your objectives, or your financial situation. We aim to bring you long-term focused analysis driven by fundamental data. Note that our analysis may not factor in the latest price-sensitive company announcements or qualitative material. Simply Wall St has no position in any stocks mentioned.
Have feedback on this article? Concerned about the content? Get in touch with us directly. Alternatively, email editorial-team@simplywallst.com