


Marsh McLennan (MRSH) Stock Could Be Cheap On Value But Pricey On Earnings
Marsh & McLennan Companies sits in an awkward spot for valuation focused investors. The Excess Returns intrinsic value estimate points to meaningful upside relative to the current share price, while the market based multiples suggest the stock is already pricing in a premium.
- Over the past 5 years, the stock has returned about 27.4%, which implies long term holders have seen moderate gains even though more recent returns have been softer.
- New offerings such as Marsh Re and cyber focused products like Cyber Protect can support expectations for future cash generation, while rising employer health benefit costs and complex risk trends may add uncertainty around how profitable that growth is.
- The broader checks give Marsh & McLennan Companies a mixed value score of 3 out of 6, which points to neither a clear bargain nor an obviously expensive stock.
The issue now is whether the intrinsic value case or the market multiple view will prove closer to how Marsh & McLennan Companies is ultimately priced.
Seize this moment to compare Marsh & McLennan Companies with a curated group of resilient peers by scanning 83 resilient stocks with low risk scores.Is Marsh & McLennan Companies a Bargain on Excess Returns?
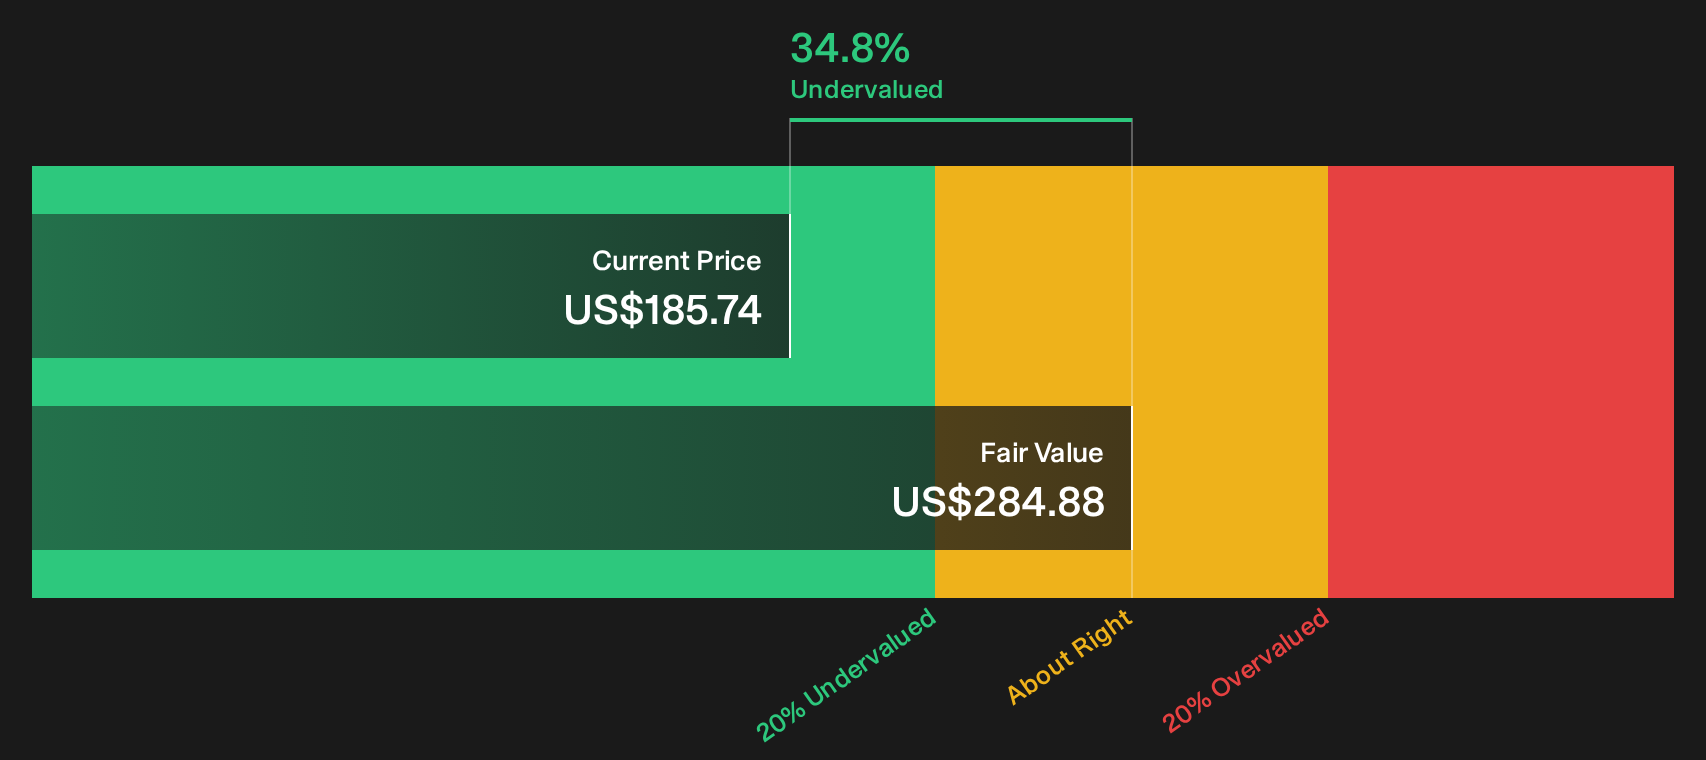
Excess Returns looks at how much profit Marsh & McLennan Companies is expected to earn over and above the cost of its equity, then capitalizes that surplus into a per share value. For Marsh & McLennan Companies, the model assumes a stable earnings power of $11.41 per share on a stable book value base of $36.06 per share, which implies an average Return on Equity of 31.64% versus a $2.61 per share cost of equity. That gap translates into an estimated excess return of $8.80 per share, which is then projected forward to arrive at a $284.88 intrinsic value.
Set against the current market price, that Excess Returns estimate implies the stock is trading at a 34.8% discount to its modeled intrinsic value. The recent Marsh survey pointing to an 8.2% rise in employer health benefit costs in 2027 helps explain why investors may be cautious, even though the model assigns value to the firm’s projected profitability within its assumptions.
On this Excess Returns view, Marsh & McLennan Companies appears undervalued relative to this estimate of intrinsic worth based on the model’s inputs.
Our Excess Returns analysis suggests Marsh & McLennan Companies is undervalued by 34.8%. Track this in your watchlist or portfolio, or discover 49 more high quality undervalued stocks.
Does Marsh & McLennan Companies Look Pricey on Earnings?
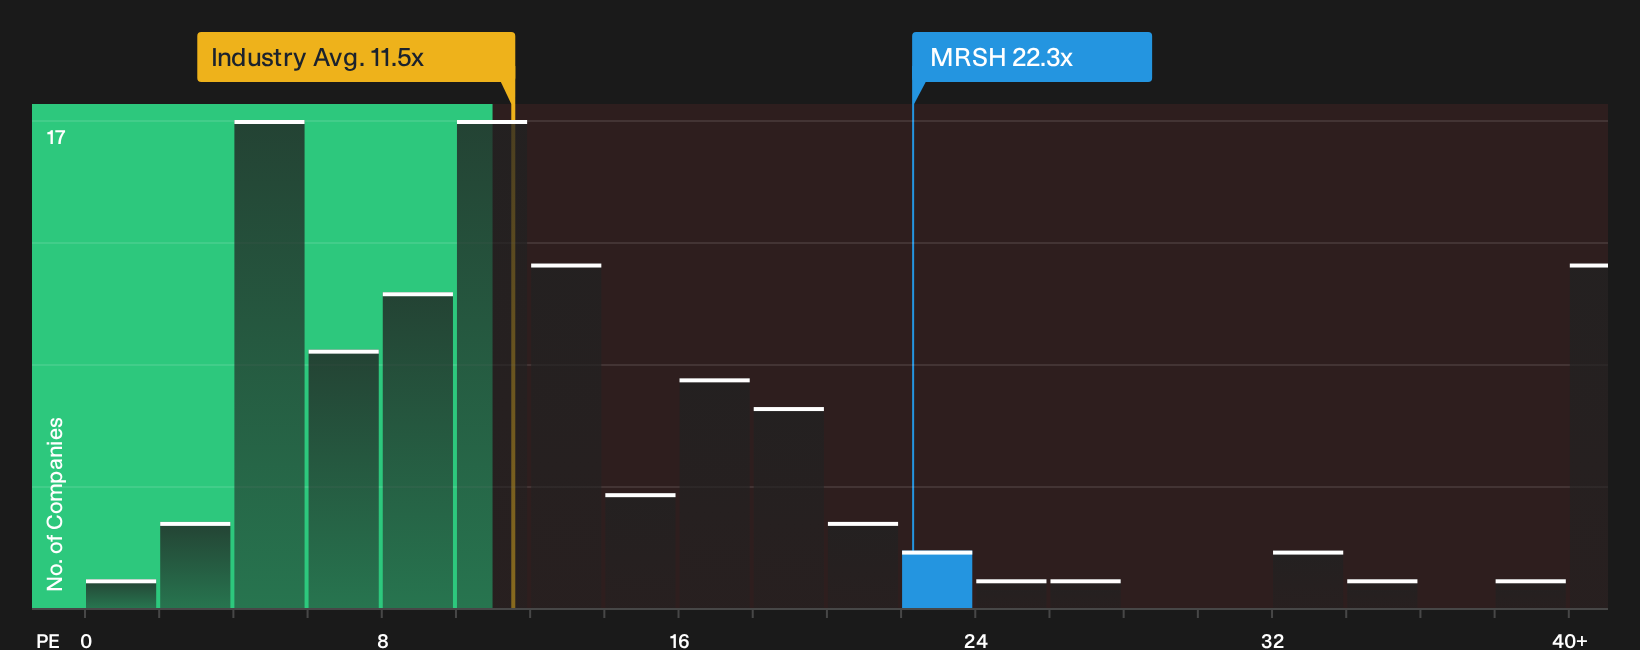
The P/E ratio is a simple way to see what investors are willing to pay for each dollar of Marsh & McLennan Companies earnings. On this yardstick, the stock trades at about 22.3x earnings, which is lower than the peer group average of 25.1x but far above the wider insurance sector on 11.5x.
A more tailored yardstick for Marsh & McLennan Companies is the modelled fair P/E of 13.9x. That figure reflects what might be reasonable given the company’s size, margins, sector and risk profile. The gap between the current 22.3x and this 13.9x reference level is sizeable. This suggests investors are willing to pay a rich price for the broker’s earnings stream even after accounting for those fundamentals.
On the P/E approach, Marsh & McLennan Companies screens as overvalued because its earnings multiple sits well above the level suggested by the fair ratio model.
See what the numbers say about this price — find out in our valuation breakdown.
The Marsh & McLennan Companies Narrative: What Would Justify Today's Price?
Simply Wall St Narratives pick up where the Marsh & McLennan Companies valuation debate leaves off by spelling out which combinations of growth, profitability and earnings power would need to hold for today’s share price to look materially higher or lower. Each narrative links its number to a clear view on how Marsh & McLennan Companies' future growth, margins and risk profile might evolve, giving you a reference point you can revisit as fresh information comes through.
Add your own narrative on Marsh & McLennan Companies' risk, health benefits and cyber story, and set out a number-driven case that others can test as new data becomes available. Be one of the first voices in the Simply Wall St community to present a clear view on whether developments like the Marsh Re rebrand and the Cyber Protect launch justify where the share price sits today.
Do you think there's more to the story for Marsh & McLennan Companies? Head over to our Community to see what others are saying!
The Bottom Line
Marsh & McLennan Companies sits between two competing readings on worth. The Excess Returns intrinsic value estimate points to meaningful upside, while the P/E based view flags an overvalued earnings multiple. That tension comes from one framework focusing on long run surplus cash generation and capital needs, and the other focusing on what investors are currently willing to pay for growth, sentiment and peers. The key question from here is whether profitability in areas like employer benefits and cyber risk supports the earnings power implied by the intrinsic value work or whether the rich multiple proves closer to the mark.
This article by Simply Wall St is general in nature. We provide commentary based on historical data and analyst forecasts only using an unbiased methodology and our articles are not intended to be financial advice. It does not constitute a recommendation to buy or sell any stock, and does not take account of your objectives, or your financial situation. We aim to bring you long-term focused analysis driven by fundamental data. Note that our analysis may not factor in the latest price-sensitive company announcements or qualitative material. Simply Wall St has no position in any stocks mentioned.
Have feedback on this article? Concerned about the content? Get in touch with us directly. Alternatively, email editorial-team@simplywallst.com