


Scott Bessent Said Interest Rates Have Fallen During Trump’s Second Term. Here’s Where He’s Right – and Where He’s Wrong.
When U.S. Treasury Secretary Scott Bessent claimed recently that interest rates have fallen since President Donald Trump’s 2025 inauguration, there’s some generalization there that needs to be unpacked.
Here’s the yield curve on Jan. 20, 2025, Inauguration Day. And the curve as it existed on Aug. 31, 2026.
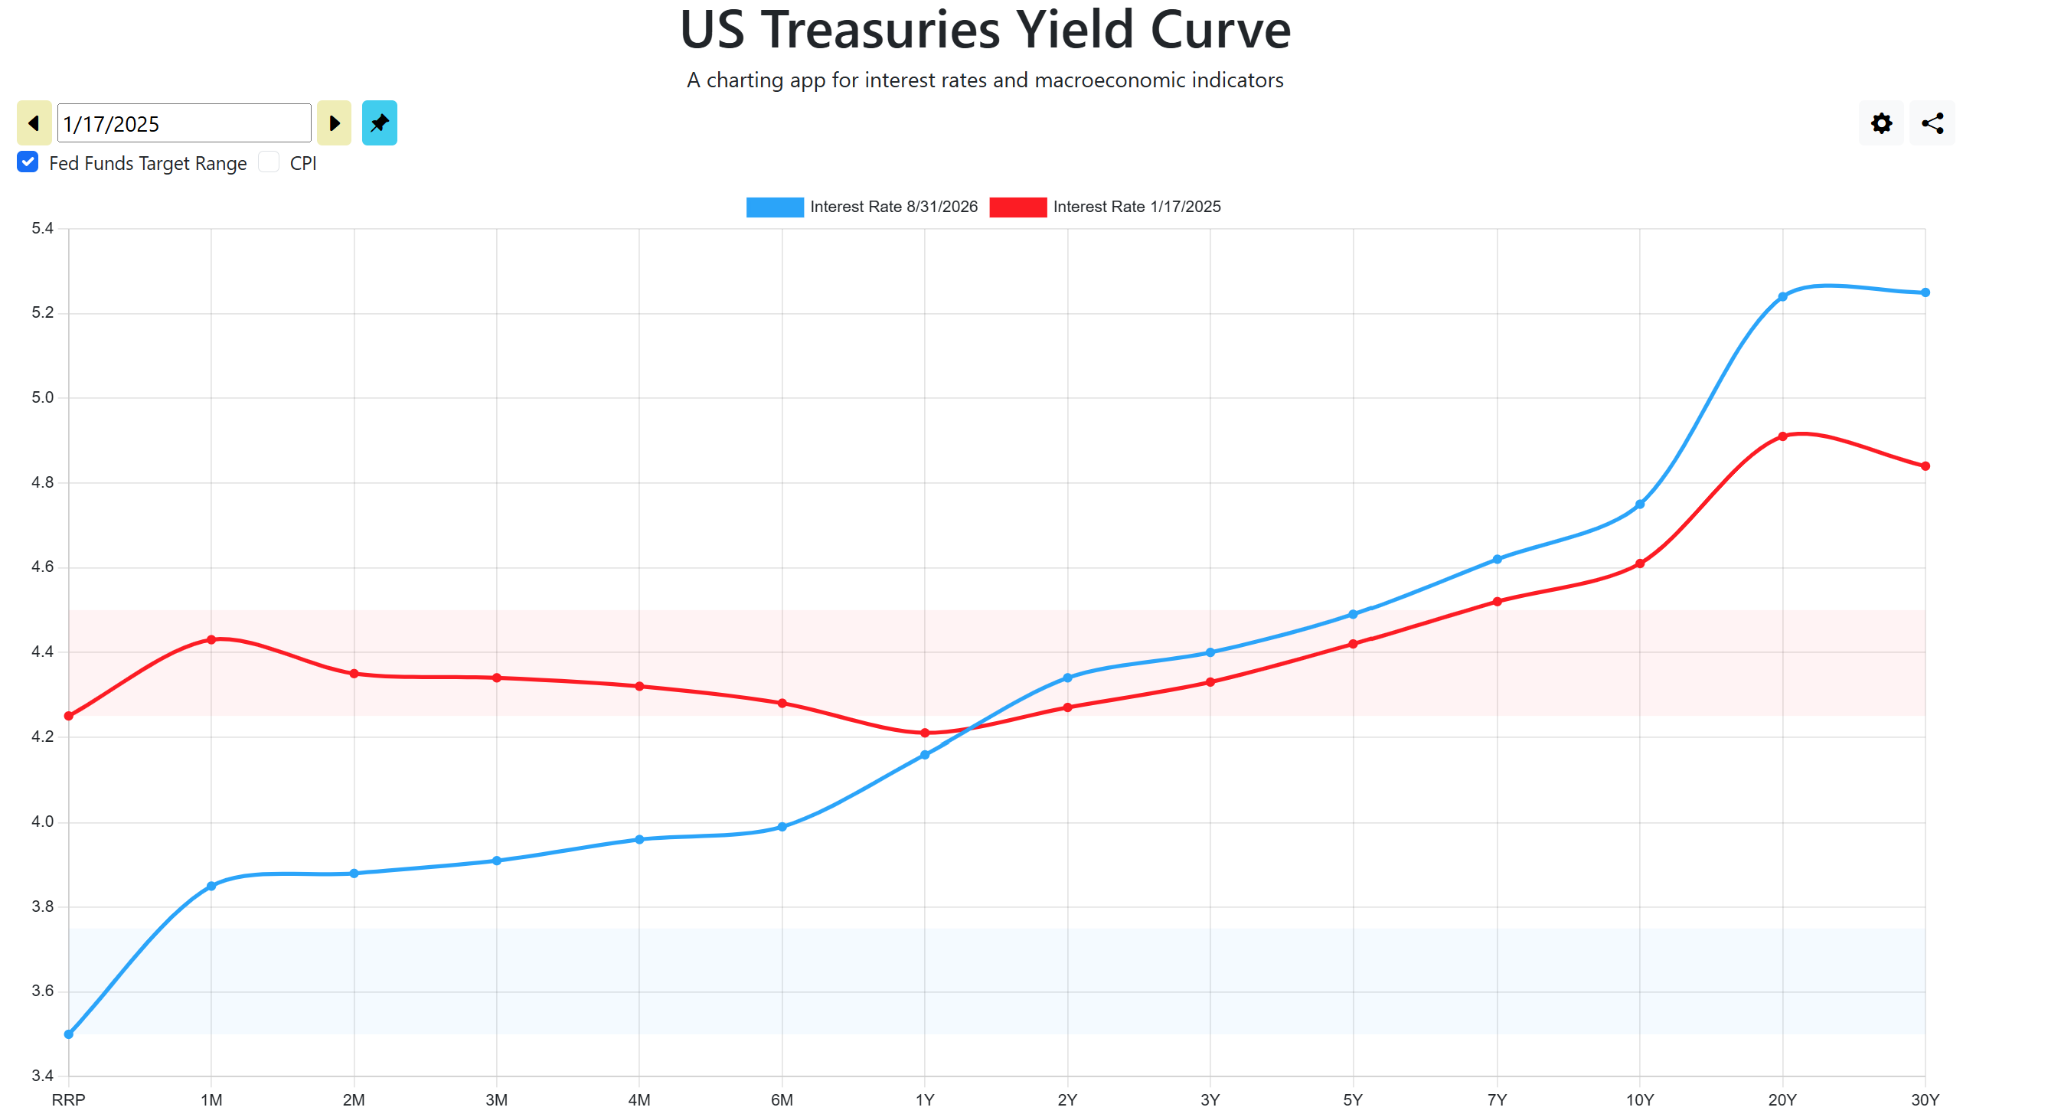
Short-term rates (overnight lending rates, T-bill rates) have indeed drifted lower. However, long-term yields, the ones that actually govern mortgage rates, corporate borrowing, and long-term economic growth? Those have climbed significantly higher. So this is sort of like the cost of milk going down, but the cost of energy going up. We spend more on energy than milk. By an even wider margin if you are lactose intolerant.
To understand why the administration’s claim feels so disconnected from everyday financial reality, you have to look at how the yield curve has reshaped itself since early 2025.
We see above that the entire curve from two years out to the longest end, 30 years, has seen higher rates since Trump’s second inauguration. That has not impacted the S&P 500 Index ($SPX), but it is gradually wearing down consumers and businesses which rely on low borrowing rates to continue rolling over their debt.
One reason I am not a fan of small-cap stocks is that roughly 40% of the companies in the Russell 2000 Index (IWM) are in the fight of their financial lives. A “debt cliff” is coming, whereby they need lower rates than we have now. Or their low-cost debt has to be replaced by high-cost debt. Which, in some cases, means the companies can’t borrow. In some of those cases, no borrowing equates to no ongoing business.
That makes this chart below, that of the 10-year Treasury bond, a potential wrecking ball for some segments of the economy. It is nearing the 4.8% mark, the top of a range with around 3.3% as its low, which is going on four full years now. If that range breaks out to new highs, you won’t need to read my articles to know about it. It will be everywhere.
If not when it rises above 4.8%, then when it hits the round and magic 5% level. It is worth noting that the 10-year has not stayed above 5% for more than a few months at any point this century. Let that sink in.
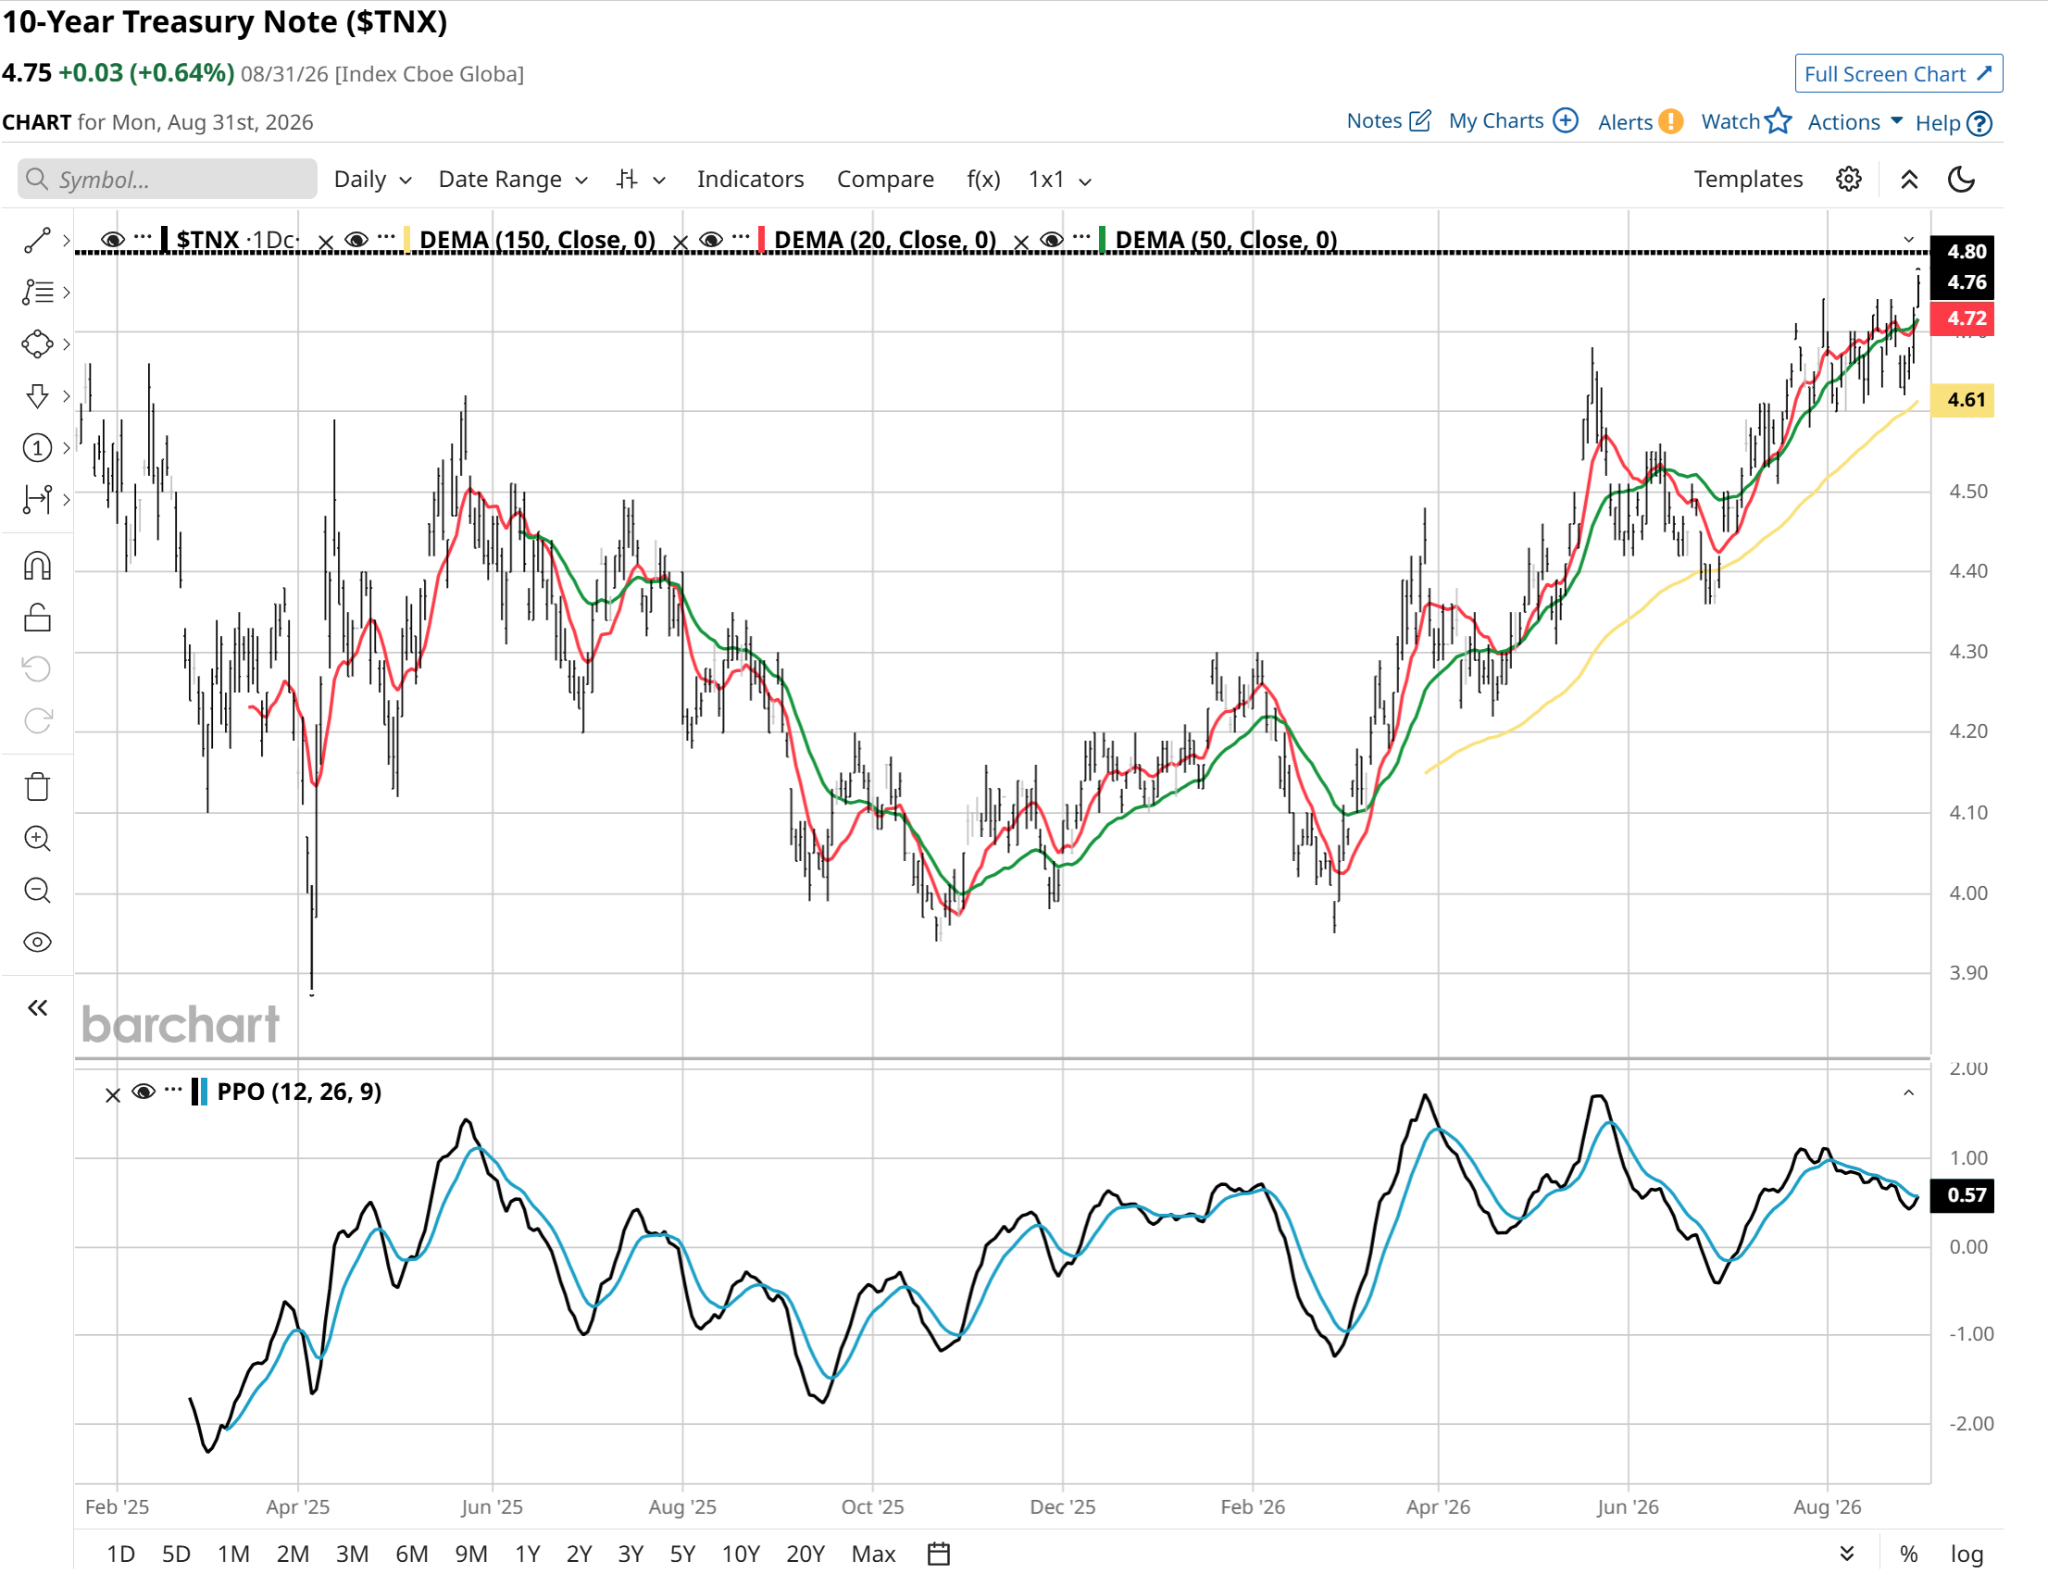
The rate argument comes down to which end of the Treasury curve you are looking at. At the short end, rates on Treasury bills and money market instruments have dipped. This drop has been driven by a combination of Federal Reserve interest rate cuts and a deliberate decision by the Treasury Department to tilt its new debt issuance toward short-dated bills rather than long-term bonds.
However, the long end of the curve tells a completely different story. Yields on 10-year and 30-year Treasury bonds have experienced persistent upward pressure since the inauguration. In fact, the 30-year U.S. Treasury yield recently touched 19-year highs near 5.2% very recently.
This dynamic is known as a “yield curve steepening.” While Washington points to falling short-term T-bill rates to declare victory on lower borrowing costs, the long-term rates that dictate the broader economy have actually tightened.
Is There Any Good News? YES!
Bessent’s statements oversimplify how Treasury messaging works these days. And perhaps the disconnect between former hedge fund managers running the government, versus the mass consumer population.
But taking his claims at face value ignores real-world borrowing costs. He is highlighting the short-term rates the government can influence more readily through lots of T-bill issuance, while downplaying the long-term yields that the global bond market actively controls.
The good news here is that if you are part of the economy that owns assets, you have an opportunity to earn nearly 5% annualized return for a lengthy period of time. While that might not sound great versus the recent returns of the S&P 500 Index, the specter of market cycles suggests that might actually be a very competitive return in the 5-10 years ahead.
Rob Isbitts is a semi-retired CIO, former fiduciary investment advisor, and Barchart columnist. Check out his other work at ETFYourself.com (featuring the Fresh Charts weekly trading post), and ROAR.PiTrade.com, helping investors to better-manage their own portfolios.
On the date of publication, Rob Isbitts did not have (either directly or indirectly) positions in any of the securities mentioned in this article. All information and data in this article is solely for informational purposes. For more information please view the Barchart Disclosure Policy here.