


Is Cintas Stock Underperforming the Nasdaq?
Cincinnati, Ohio-based Cintas Corporation (CTAS) provides corporate identity uniforms and related business services. With a market cap of $79.3 billion, the company sells uniforms and work apparel, as well as entrance mats, restroom supplies, promotional products, document management, fire protection, and first aid and safety services.
Companies worth $10 billion or more are generally described as “large-cap stocks,” and CTAS perfectly fits that description, with its market cap exceeding this mark, underscoring its size, influence, and dominance within the specialty business services industry. CTAS’ growth is fueled by its ability to expand its customer base and enhance its service offerings through strategic acquisitions. Its operational excellence is evident in the improved cost efficiency of uniform rental and facility services, driving profitability and providing room for investment in further growth initiatives.
Despite its notable strength, CTAS slipped 8.3% from its 52-week high of $219.16, achieved on Jul. 29. Over the past three months, CTAS stock gained 15.1%, outperforming the Nasdaq Composite’s ($NASX) 1% dip during the same time frame.
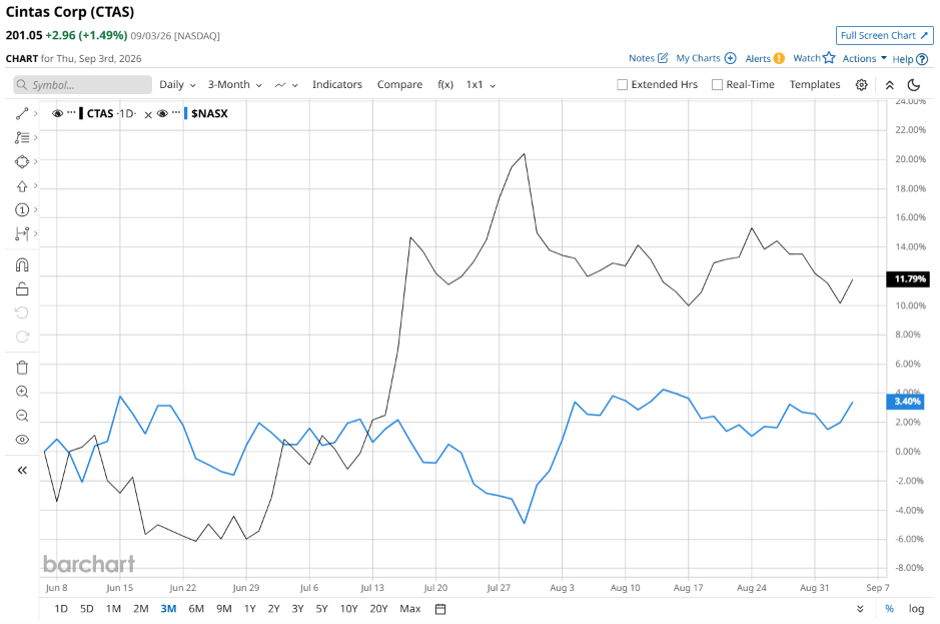
Shares of CTAS rose 6.9% on a YTD basis but dipped 2.2% over the past 52 weeks, underperforming NASX’s YTD gains of 14.4% and 23.7% returns over the last year.
To confirm the bullish trend, CTAS is trading above its 50-day moving average since early June, with some fluctuations. The stock has been trading above its 200-day moving average since mid-July.
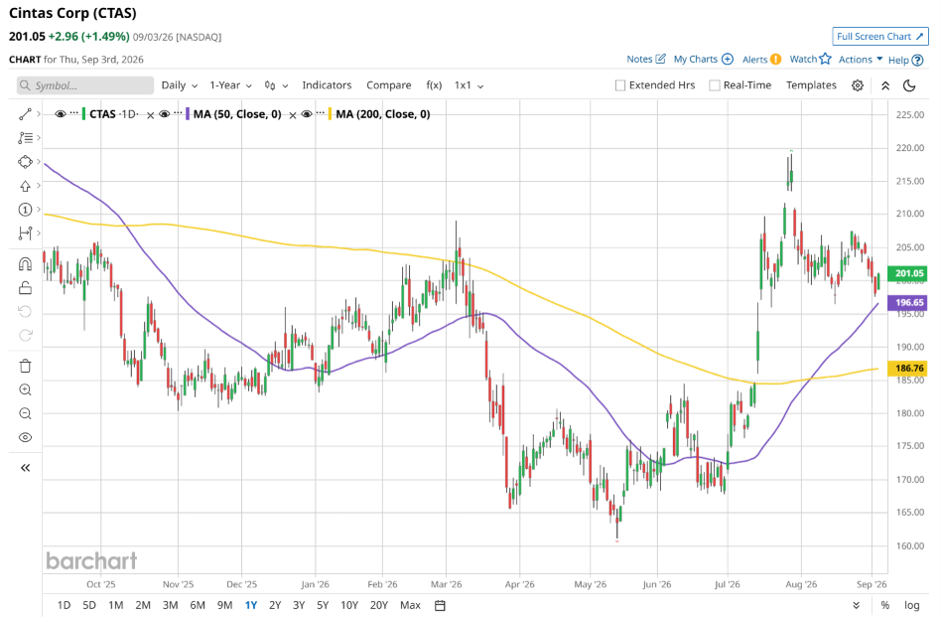
Despite record margins and strong financial beats, CTAS underperformed due to a classic "priced for perfection" dynamic. Additionally, investor caution over FTC regulatory reviews and integration risks surrounding its pending UniFirst Corporation (UNF) acquisition, capped equity upside despite solid operational execution.
On Jul. 15, CTAS shares rose 4.4% after reporting its Q4 results. Its adjusted EPS of $1.29 topped Wall Street expectations of $1.24. The company’s revenue was $2.91 billion, beating Wall Street forecasts of $2.88 billion. CTAS expects full-year adjusted EPS in the range of $5.36 to $5.50, and revenue in the range of $12.1 billion to $12.3 billion.
In the competitive arena of specialty business services, ABM Industries Incorporated (ABM) has taken the lead over CTAS, showing resilience with an 11.7% gain on a YTD basis. However, ABM lagged behind the stock with a 3.1% downtick over the past 52 weeks.
Wall Street analysts are reasonably bullish on CTAS’ prospects. The stock has a consensus “Moderate Buy” rating from the 20 analysts covering it, and the mean price target of $217.44 suggests a potential upside of 8.2% from current price levels.
On the date of publication, Neha Panjwani did not have (either directly or indirectly) positions in any of the securities mentioned in this article. All information and data in this article is solely for informational purposes. For more information please view the Barchart Disclosure Policy here.