


Cowell E Holdings (SEHK:1415) Gets A Fresh Valuation Look On Strong H1 2026 Results
Cowell e Holdings (SEHK:1415) has drawn investor attention after reporting first half 2026 results, with higher sales, net income and earnings per share compared with a year earlier.
See our latest analysis for Cowell e Holdings.
The latest earnings news and the new share repurchase mandate appear to be feeding into Cowell e Holdings' share price, with a 1-day share price return of 1.04% and a 30-day return of 9.90%. However, the 90-day share price return is down 22.37% and the 1-year total shareholder return is down 25.67%, compared with a very large 5-year total shareholder return of over 3x. This points to longer term momentum that has recently cooled.
If recent moves in Cowell e Holdings have you thinking about other opportunities in tech hardware, you can widen your search using the Simply Wall St screener and see 54 AI infrastructure stocks
Given Cowell e Holdings' stronger recent earnings but weaker 1 year return, the key issue now is whether the market has already priced in the good news, or if the current valuation still points to further upside.
Price-to-Earnings of 11.8x: Is it justified?
On valuation, Cowell e Holdings currently trades on a P/E of 11.8x, which screens as good value compared both with peers and the wider Hong Kong Electronic industry.
The P/E ratio compares the current share price to earnings per share. For a profitable hardware and components business like Cowell e Holdings, it is a common way investors gauge how much they are paying for each dollar of earnings.
Analysts forecast earnings growth of 22.2% per year and revenue growth of 19.7% per year, which is faster than the wider Hong Kong market. Combined with a Return on Equity of 26.7% and high quality earnings, the current 11.8x multiple suggests the market is pricing these earnings at a lower level than both the peer average of 26.1x and the Electronic industry average of 15.2x. The estimated fair P/E of 13.9x also sits above the current multiple and provides a reference point that some investors may watch if sentiment shifts.
Explore the SWS fair ratio for Cowell e Holdings
Result: Price-to-Earnings of 11.8x (UNDERVALUED)
However, investors still face risks if Cowell e Holdings' earnings growth slows from current projections or if demand for smartphone and tablet camera modules weakens.
Find out about the key risks to this Cowell e Holdings narrative.
Another view on Cowell e Holdings using DCF
While the 11.8x P/E ratio frames Cowell e Holdings as good value against peers, the SWS DCF model presents an even starker picture. With the share price at HK$23.32 and an estimated future cash flow value of HK$68.15, the stock appears deeply undervalued using this method.
The contrast between a modestly low P/E and a much higher DCF value raises a practical question: Is the market underestimating Cowell e Holdings' future cash generation, or are the DCF assumptions too generous for current conditions?
Look into how the SWS DCF model arrives at its fair value.
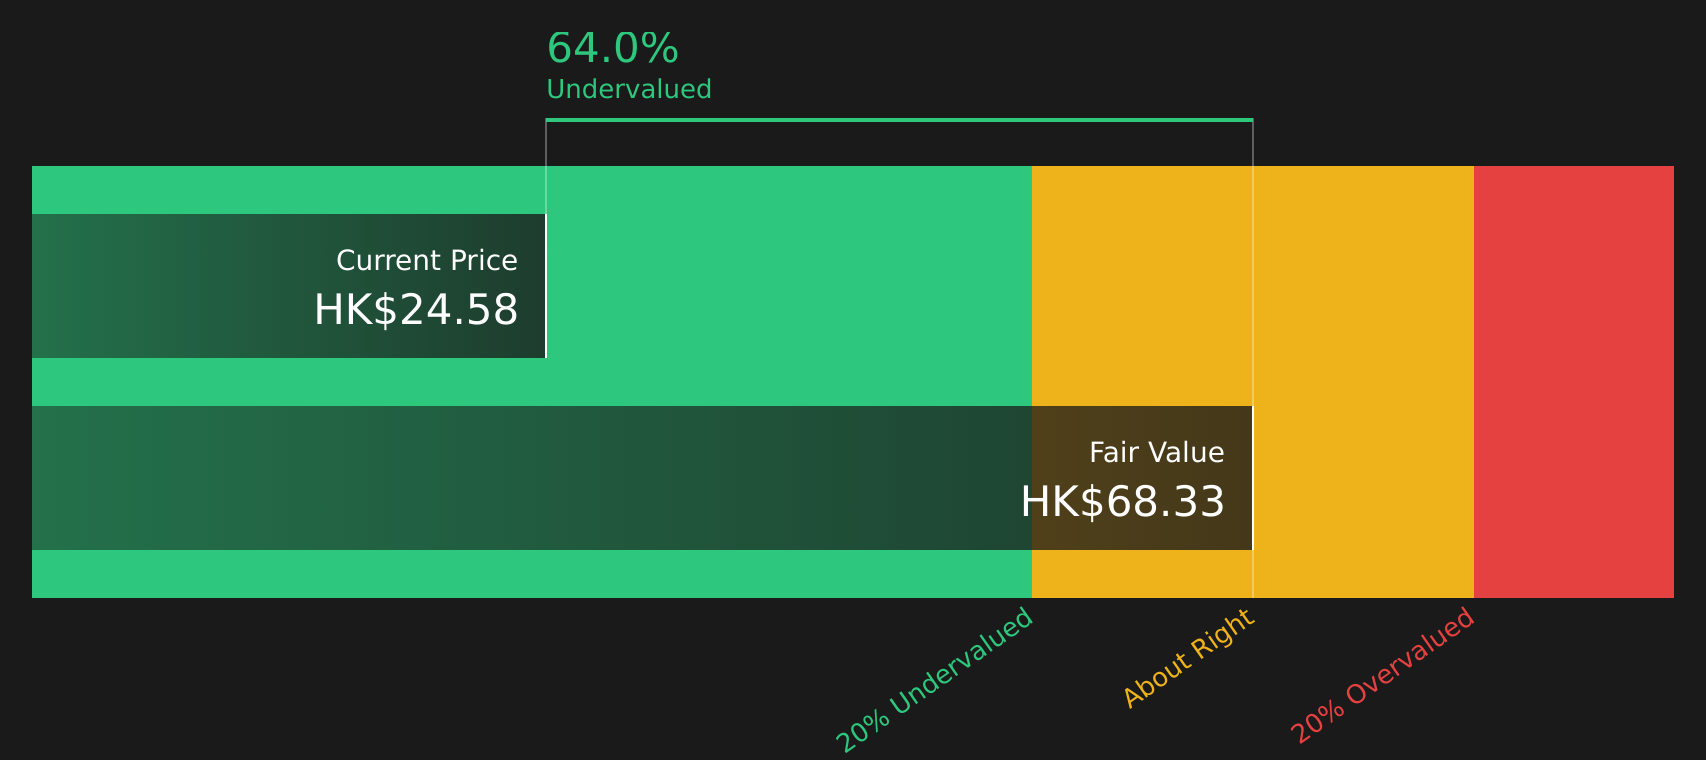
Simply Wall St performs a discounted cash flow (DCF) on every stock in the world every day (check out Cowell e Holdings for example). We show the entire calculation in full. You can track the result in your watchlist or portfolio and be alerted when this changes, or use our stock screener to discover 268 high quality undervalued stocks. If you save a screener we even alert you when new companies match - so you never miss a potential opportunity.
Next Steps
Given the mixed signals around Cowell e Holdings, it makes sense to review the numbers yourself and move quickly if you see a clear angle. To understand what positive factors analysts are watching, take a closer look at the 4 key rewards
Looking for more investment ideas beyond Cowell e Holdings?
If Cowell e Holdings has sharpened your focus, do not stop there. A wider set of ideas can help you spot risks, compare valuations and build a stronger portfolio.
- Target potential bargains by scanning companies that combine quality metrics with low valuations using the 268 high quality undervalued stocks.
- Prioritise resilience by focusing on businesses with stronger finances and funding flexibility through the solid balance sheet and fundamentals stocks screener (427 results).
- Get ahead of the crowd by spotting underfollowed opportunities that still show solid fundamentals with the screener containing 610 high quality undiscovered gems.
This article by Simply Wall St is general in nature. We provide commentary based on historical data and analyst forecasts only using an unbiased methodology and our articles are not intended to be financial advice. It does not constitute a recommendation to buy or sell any stock, and does not take account of your objectives, or your financial situation. We aim to bring you long-term focused analysis driven by fundamental data. Note that our analysis may not factor in the latest price-sensitive company announcements or qualitative material. Simply Wall St has no position in any stocks mentioned.
Have feedback on this article? Concerned about the content? Get in touch with us directly. Alternatively, email editorial-team@simplywallst.com