


Cisco (CSCO) Stock Still Looks Undervalued As Its 3 Year Gain Hits 115%
Cisco Systems stock has more than doubled over the past three years, yet current valuation checks still lean toward the shares pricing in less than their estimated worth. The intrinsic value estimate using a Discounted Cash Flow (DCF) framework and the market multiples both point to Cisco trading at a discount while the price has already had a strong run.
- Cisco Systems has delivered a 114.7% return over the past three years, which puts recent weakness into context and raises the question of how much upside may be left.
- The company is pushing hard into AI driven networking, collaboration and security, which can support revenue expectations. However, execution risks around large scale AI deployments and changing investor expectations remain a potential drag on how the market prices that growth.
- The stock screens as undervalued on most of Simply Wall St's checks, with a high value score of 5 out of 6, which suggests the broader picture leans cheap rather than expensive.
The issue now is whether Cisco Systems' recent pullback and a Discounted Cash Flow (DCF) estimate that sits about 28.5% above the last close of US$109.58 still add up to an attractive entry point on valuation alone.
Find out why Cisco Systems' 66.9% return over the last year is lagging behind its peers.
Is Cisco Systems a Bargain on Cash Flow?
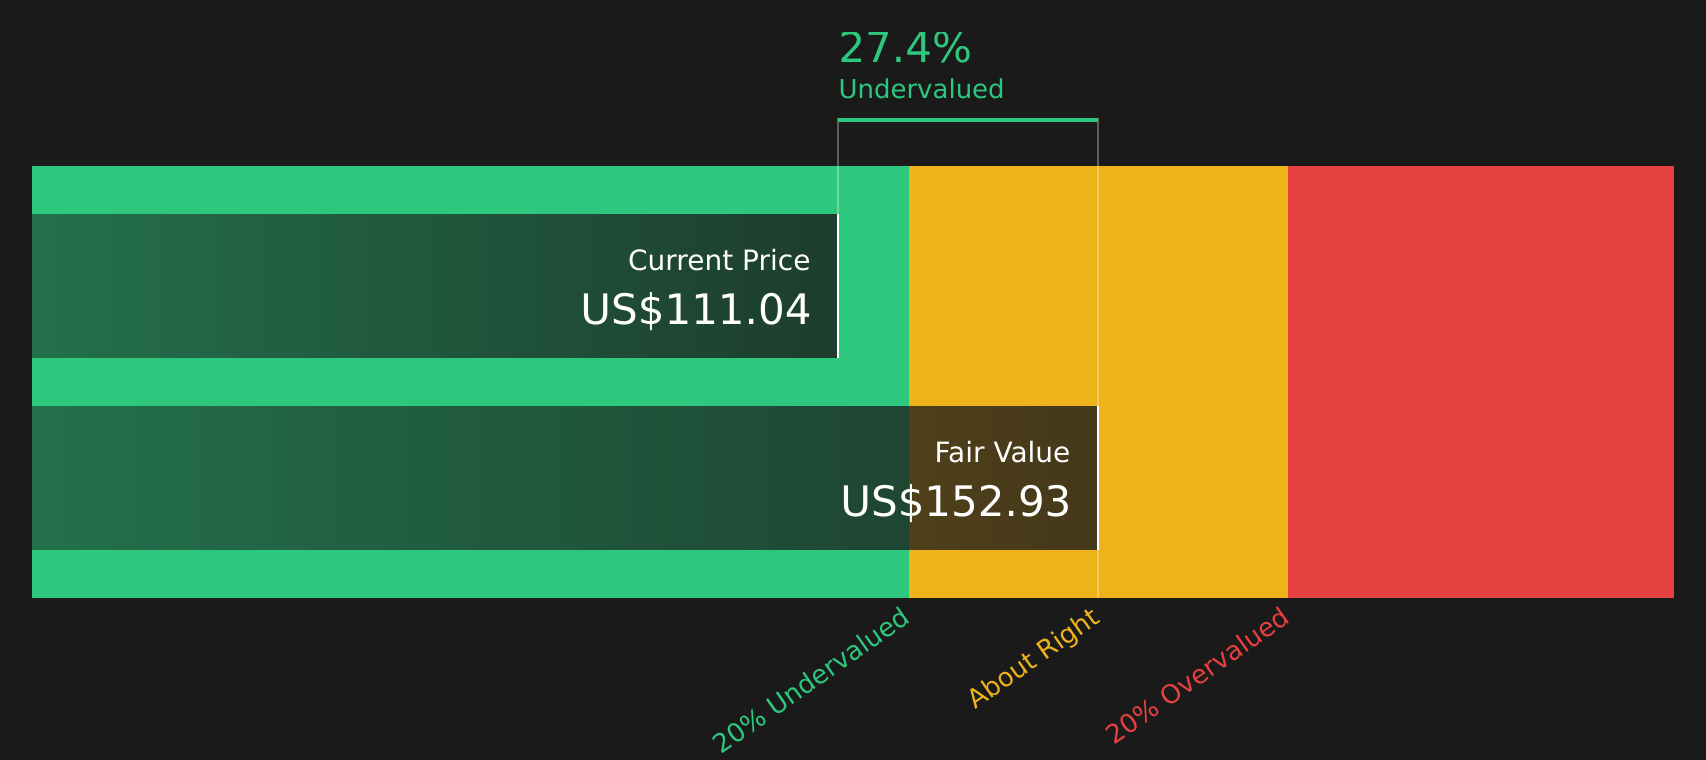
The Discounted Cash Flow (DCF) model estimates what Cisco Systems might be worth based on the cash it is expected to generate for shareholders. Cisco produced about $13.1b of free cash flow over the last twelve months, and the model assumes this cash flow continues to grow rather than shrink. On that basis, the 2 Stage Free Cash Flow to Equity approach points to an intrinsic value of about $153 per share.
Set against the recent share price of $109.58, the DCF suggests Cisco Systems screens as roughly 28.5% undervalued. The recent pullback after mixed reactions to earnings and services revenue, as highlighted in the July 2026 results, helps explain why the market price still trails the value implied by the company’s cash generation.
Put simply, the DCF workup indicates Cisco Systems stock appears undervalued relative to the cash flows currently built into the model.
Our Discounted Cash Flow (DCF) analysis suggests Cisco Systems is undervalued by 28.5%. Track this in your watchlist or portfolio, or discover 50 more high quality undervalued stocks.
Is Cisco Systems Still Cheap on Earnings?
P/E is often the cleanest way to compare Cisco Systems with other large, mature tech companies that generate consistent earnings. On this measure, Cisco trades on about 32.6x earnings, which is slightly above the Communications industry average of 31.3x but sits at a clear discount to the broader peer group average of 64.4x.
The internal fair P/E ratio for Cisco Systems is estimated at 36.3x. That is higher than the current 32.6x level, which indicates that the stock is trading below the multiple suggested by its size, profitability profile and risk characteristics. In other words, while Cisco is not the cheapest stock in its industry on simple averages, it still trades below the tailored fair value multiple implied by this framework.
On the P/E multiple alone, Cisco Systems stock appears undervalued relative to the fair ratio that reflects its earnings profile and risk.

See what the numbers say about this price — find out in our valuation breakdown.
The Cisco Systems Narrative: What Would Justify Today's Price?
Simply Wall St Narratives for Cisco Systems pick up where the valuation checks leave off and describe the specific future paths for growth, margins and earnings that would need to occur for Cisco Systems' stock to be worth materially more or less than its current price. Instead of providing a single output from a ratio or model, these narratives explain the underlying assumptions so you can track how Cisco Systems' actual progress aligns with them on the Community page.
One of the top community narratives on Cisco Systems: roughly fairly valued
"Cisco already generates 50% of revenue from subscriptions and software, which means less reliance on hardware cycles and more scalable revenue…"
Read one of the top narratives on Cisco Systems
Do you think there's more to the story for Cisco Systems? Head over to our Community to see what others are saying!
The Bottom Line
Cisco Systems screens as undervalued on both the Discounted Cash Flow (DCF) intrinsic value estimate and the earnings multiple framework, which is a reasonably rare alignment for a large, profitable tech stock. The broader valuation checks also lean supportive, so the market is still applying a discount despite the company’s scale and cash generation profile. What matters from here is whether Cisco can execute on its AI related push in networking, collaboration and security. If that execution stalls, the current discount may prove justified rather than an opportunity.
This article by Simply Wall St is general in nature. We provide commentary based on historical data and analyst forecasts only using an unbiased methodology and our articles are not intended to be financial advice. It does not constitute a recommendation to buy or sell any stock, and does not take account of your objectives, or your financial situation. We aim to bring you long-term focused analysis driven by fundamental data. Note that our analysis may not factor in the latest price-sensitive company announcements or qualitative material. Simply Wall St has no position in any stocks mentioned.
Have feedback on this article? Concerned about the content? Get in touch with us directly. Alternatively, email editorial-team@simplywallst.com