


FLEX LNG (FLNG) Is Up 10.1% After Beating Q2 2026 EPS And Maintaining 2026 Guidance
- FLEX LNG Ltd. has reported past second-quarter 2026 results showing net income of US$44.85 million and basic earnings per share of US$0.83, alongside a declared second-quarter dividend of US$0.75 per share payable around September 17, 2026.
- The company also maintained its full-year 2026 revenue and earnings guidance despite market volatility, highlighting management’s confidence in its contracted LNG shipping business model and earnings visibility.
- With FLEX LNG’s strong second-quarter earnings and maintained full-year guidance now on the table, we’ll assess how this affects its investment narrative.
Rare earth metals are the new gold rush. Find out which 28 stocks are leading the charge.
FLEX LNG Investment Narrative Recap
To own FLEX LNG, you need to believe in the resilience of its long-term LNG shipping contracts and their ability to support earnings through industry swings. The strong second quarter 2026 results and reaffirmed full-year guidance support this contracted-earnings story, but they do not materially change the near term risk that high dividends and buybacks could limit balance sheet flexibility if conditions worsen.
The most relevant recent announcement here is FLEX LNG’s decision to maintain its full year 2026 revenue and earnings guidance despite market volatility. That stance sits alongside solid first half 2026 earnings and a continuing US$0.75 per share quarterly dividend, reinforcing the idea of stable contracted cash flows while also sharpening the question of how much cash is being retained for future fleet renewal or debt reduction.
Yet behind the steady dividends and earnings guidance, investors should be aware that the company’s generous payout policy could...
Read the full narrative on FLEX LNG (it's free!)
FLEX LNG's narrative projects $354.9 million revenue and $132.9 million earnings by 2029.
Uncover how FLEX LNG's forecasts yield a $25.92 fair value, a 20% downside to its current price.
Exploring Other Perspectives
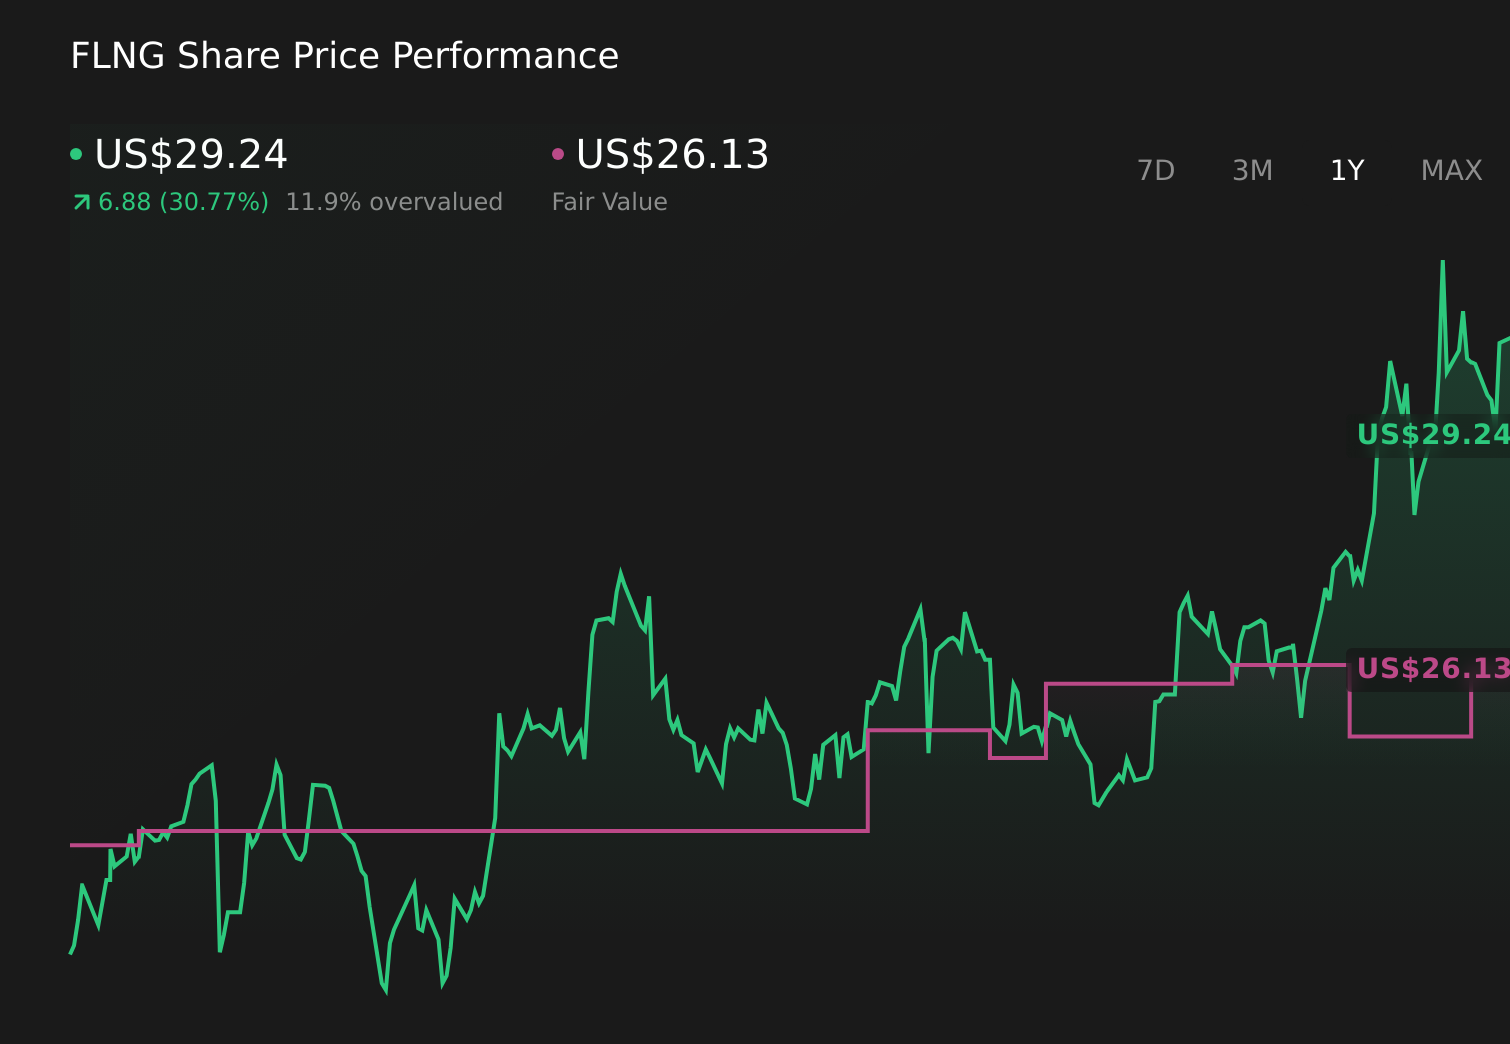
Two fair value estimates from the Simply Wall St Community span a wide range, from about US$25.92 up to roughly US$73.68 per share, showing how far apart individual views can be. You can weigh these against the catalyst of FLEX LNG’s long term charter backlog, which underpins its earnings visibility and frames very different expectations about how the business might perform over time.
Explore 2 other fair value estimates on FLEX LNG - why the stock might be worth over 2x more than the current price!
Reach Your Own Conclusion
Don't just follow the ticker - dig into the data and build a conviction that's truly your own.
- A great starting point for your FLEX LNG research is our analysis highlighting 1 key reward and 3 important warning signs that could impact your investment decision.
- Our free FLEX LNG research report provides a comprehensive fundamental analysis summarized in a single visual - the Snowflake - making it easy to evaluate FLEX LNG's overall financial health at a glance.
Seeking Other Investments?
Right now could be the best entry point. These picks are fresh from our daily scans. Don't delay:
- We've uncovered the 12 dividend fortresses yielding 5%+ that don't just survive market storms, but thrive in them.
- AI is about to change healthcare. These 42 stocks are working on everything from early diagnostics to drug discovery. The best part - they are all under $10b in market cap - there's still time to get in early.
- The future of work is here. Discover the 38 top robotics and automation stocks leading the charge in AI-driven automation and industrial transformation.
This article by Simply Wall St is general in nature. We provide commentary based on historical data and analyst forecasts only using an unbiased methodology and our articles are not intended to be financial advice. It does not constitute a recommendation to buy or sell any stock, and does not take account of your objectives, or your financial situation. We aim to bring you long-term focused analysis driven by fundamental data. Note that our analysis may not factor in the latest price-sensitive company announcements or qualitative material. Simply Wall St has no position in any stocks mentioned.
Have feedback on this article? Concerned about the content? Get in touch with us directly. Alternatively, email editorial-team@simplywallst.com