


Asian Market Stocks That Might Be Trading At Discounts Up To 20.3%
The Asian markets have recently experienced mixed performance, with some regions facing challenges from geopolitical tensions and economic uncertainties, while others see opportunities in sectors like technology and infrastructure. In this context, identifying undervalued stocks can be particularly appealing to investors seeking potential value plays amid the volatility. A good stock in this environment is one that demonstrates strong fundamentals and resilience against market fluctuations, offering a potential discount relative to its intrinsic value.
Top 10 Undervalued Stocks Based On Cash Flows In Asia
| Name | Current Price | Fair Value (Est) | Discount (Est) |
| Zijin Gold International (SEHK:2259) | HK$117.10 | HK$230.92 | 49.3% |
| Sichuan Kelun-Biotech Biopharmaceutical (SEHK:6990) | HK$481.80 | HK$947.85 | 49.2% |
| Precision Tsugami (China) (SEHK:1651) | HK$55.95 | HK$108.96 | 48.7% |
| Pan-United (SGX:P52) | SGD1.61 | SGD3.13 | 48.5% |
| NC Chem (KOSDAQ:A482630) | ₩12890.00 | ₩25582.56 | 49.6% |
| Livero (TSE:9245) | ¥2146.00 | ¥4191.45 | 48.8% |
| GKG Precision Machine (SZSE:301338) | CN¥84.75 | CN¥169.04 | 49.9% |
| CSPC Innovation Pharmaceutical (SZSE:300765) | CN¥37.36 | CN¥74.24 | 49.7% |
| COVER (TSE:5253) | ¥1459.00 | ¥2827.69 | 48.4% |
| BuySell TechnologiesLtd (TSE:7685) | ¥2980.00 | ¥5806.55 | 48.7% |
We'll examine a selection from our screener results.
Kehua Data (SZSE:002335)
Overview: Kehua Data Co., Ltd. offers integrated solutions for power protection and energy conservation both in China and internationally, with a market cap of CN¥23.38 billion.
Operations: Kehua Data's revenue is derived from providing integrated solutions focused on power protection and energy conservation across both domestic and international markets.
Estimated Discount To Fair Value: 20.3%
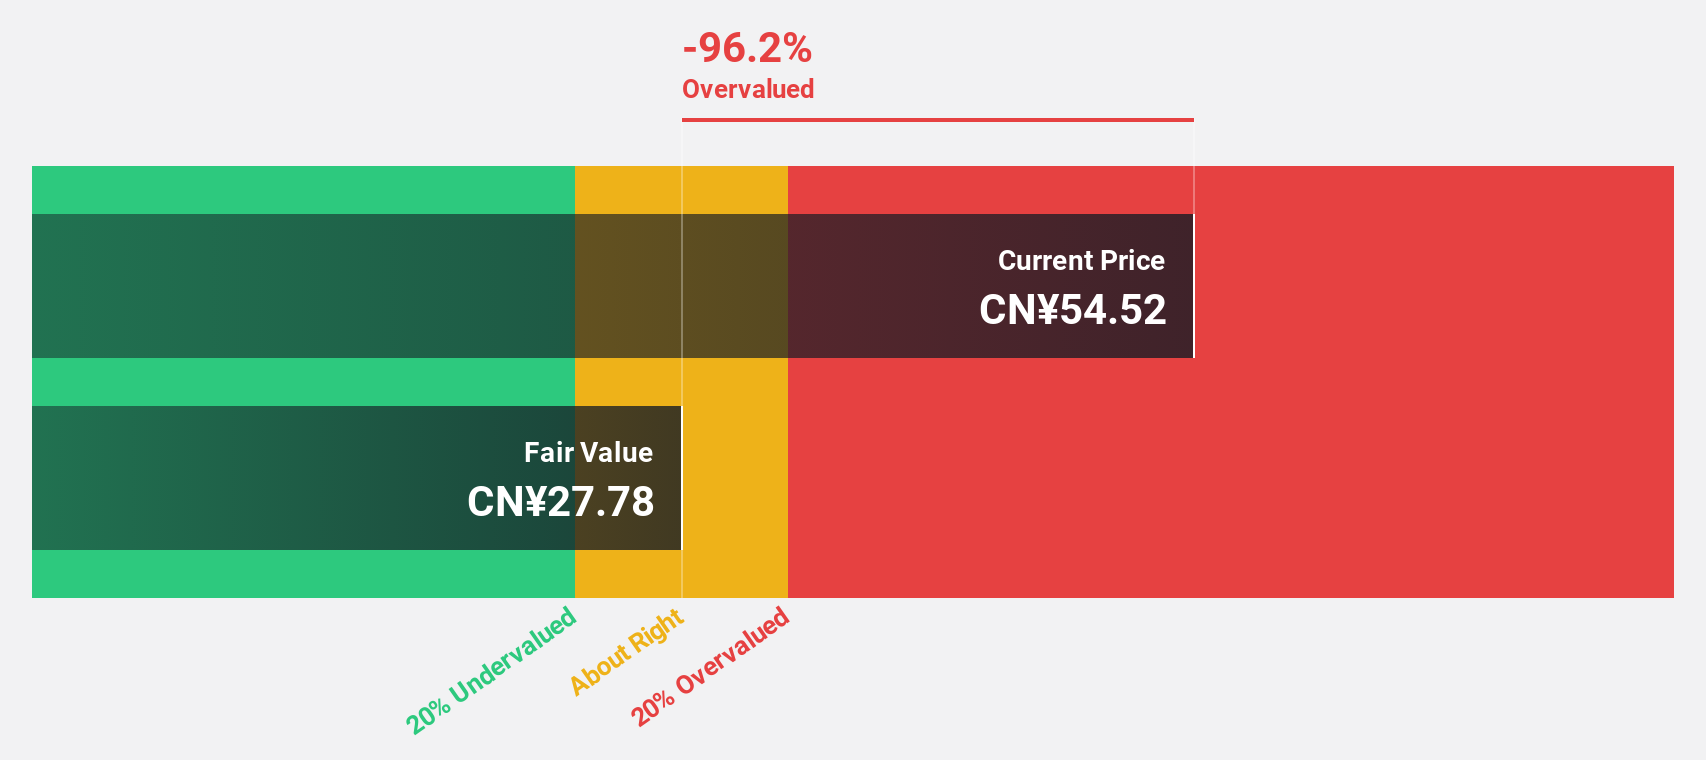
Kehua Data is trading at CN¥30.99, undervalued by over 20% compared to its estimated future cash flow value of CN¥38.9. Analysts agree on a potential price rise of 46.4%. Earnings grew by 37.5% last year and are expected to grow significantly, outpacing the Chinese market with a forecasted annual growth rate of 34.2%. However, its return on equity is projected to remain low at 15.4%, and it has an unstable dividend track record.
- Our comprehensive growth report raises the possibility that Kehua Data is poised for substantial financial growth.
- Dive into the specifics of Kehua Data here with our thorough financial health report.
T&S CommunicationsLtd (SZSE:300570)
Overview: T&S Communications Co., Ltd. develops, manufactures, and sells fiber optics communication products both in China and internationally, with a market cap of CN¥29.76 billion.
Operations: The company generates revenue primarily from Optical Communication Components, amounting to CN¥1.49 billion.
Estimated Discount To Fair Value: 12.9%
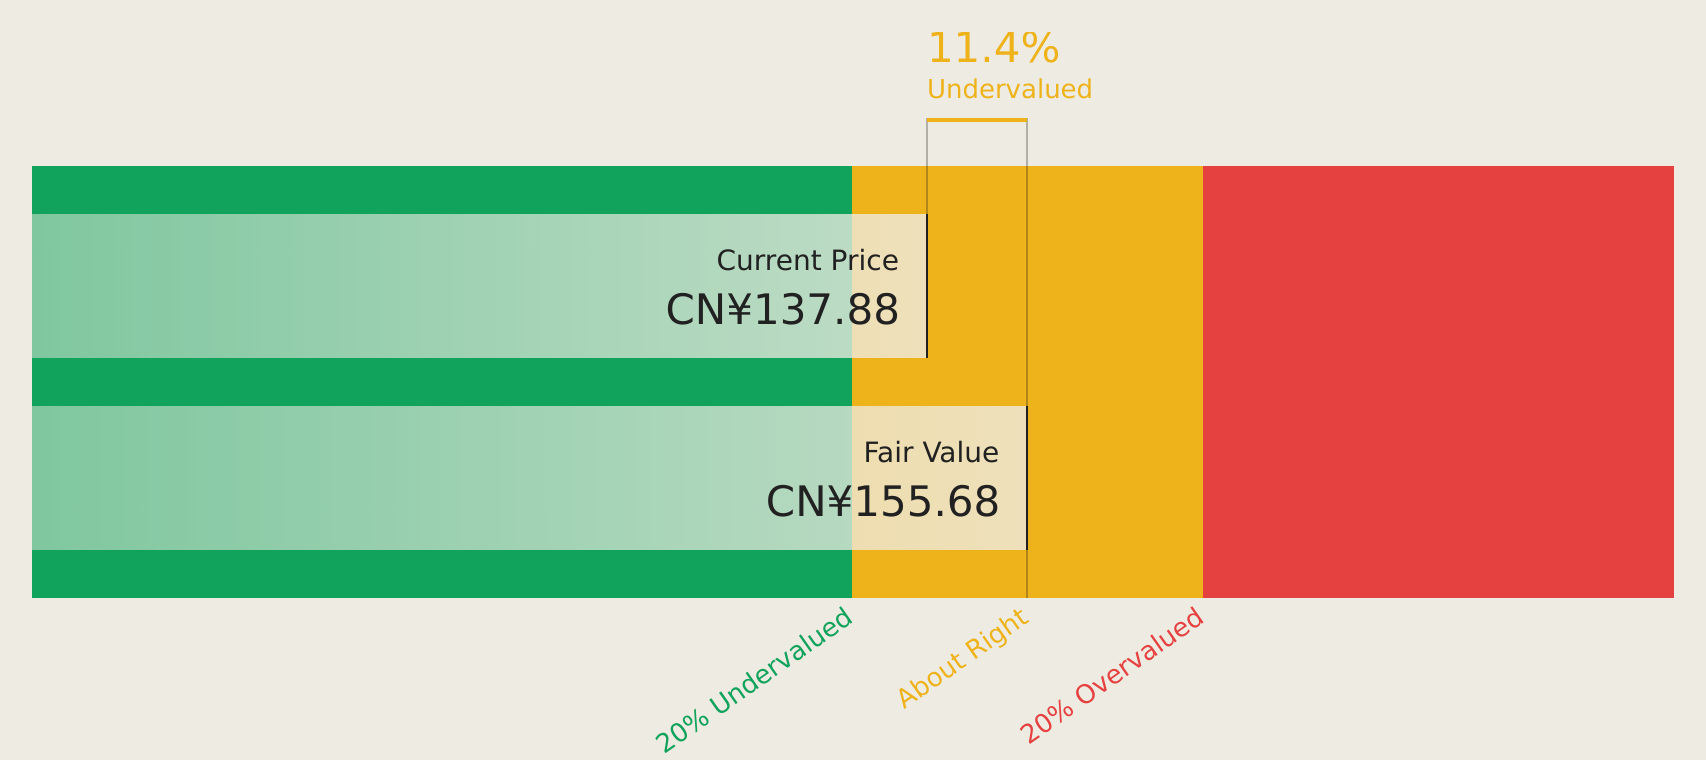
T&S Communications Ltd. is trading at CN¥133.8, which is 12.9% below its estimated future cash flow value of CN¥153.64, indicating undervaluation based on discounted cash flows. Despite a highly volatile share price recently, the company boasts significant forecasted earnings growth of 52.3% annually over the next three years, outpacing market averages in China. However, its dividend yield of 0.75% lacks sufficient coverage by free cash flows and non-cash earnings remain high.
- Our growth report here indicates T&S CommunicationsLtd may be poised for an improving outlook.
- Unlock comprehensive insights into our analysis of T&S CommunicationsLtd stock in this financial health report.
WPG Holdings (TWSE:3702)
Overview: WPG Holdings Limited, along with its subsidiaries, operates as a semiconductor components distributor in Taiwan, Mainland China, and internationally with a market cap of NT$197.30 billion.
Operations: The company's revenue segments include Trigold Group Co. with NT$43.97 billion, Quandingzi Group Co. with NT$194.26 billion, and World Pease Industrial Subgroup contributing NT$549.98 billion.
Estimated Discount To Fair Value: 16%
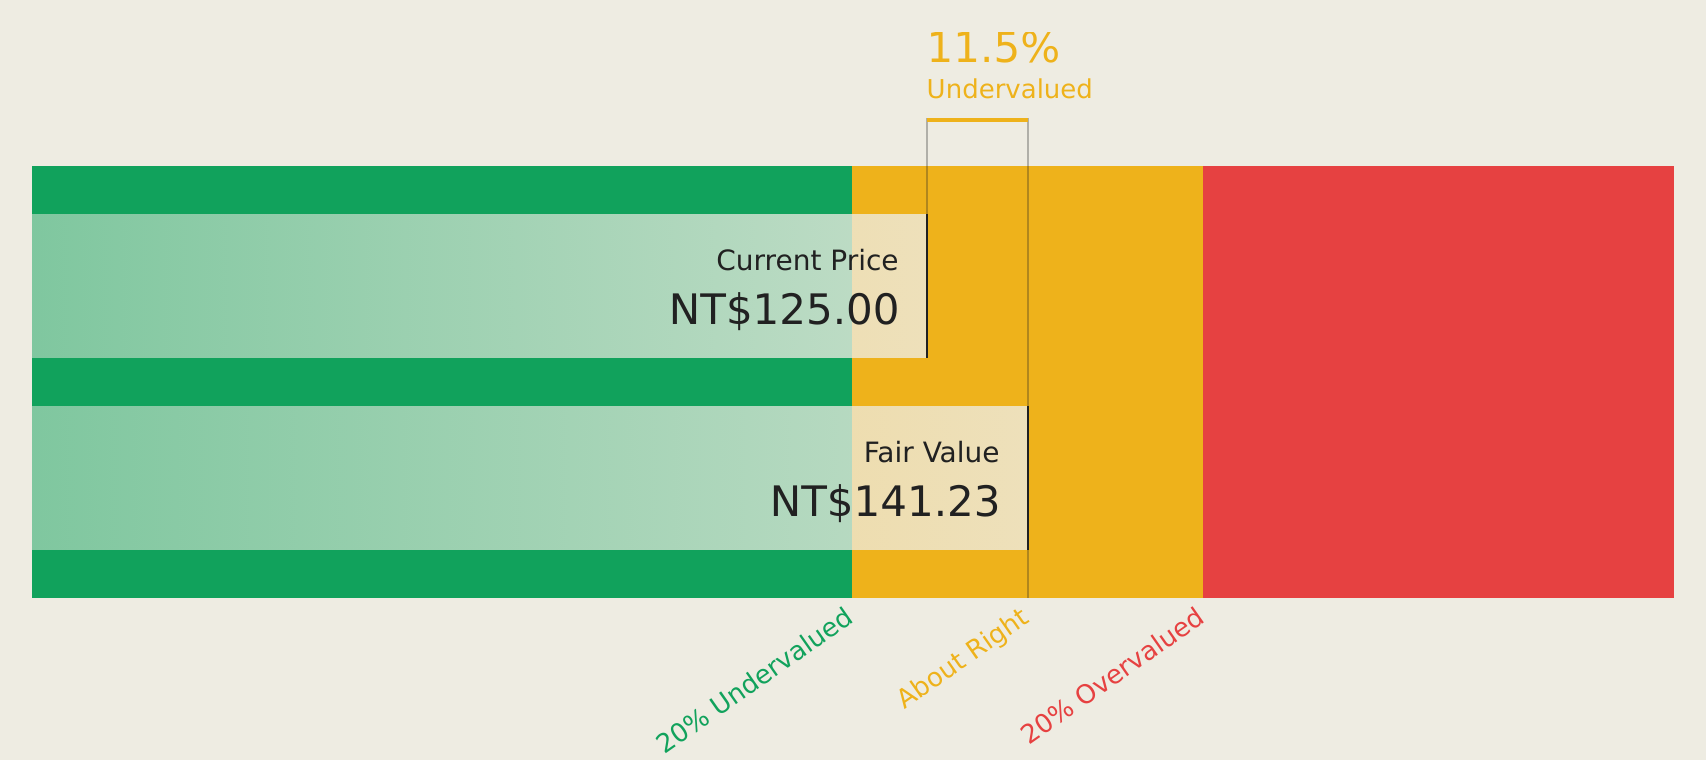
WPG Holdings is trading at NT$117.5, below its estimated future cash flow value of NT$139.85, reflecting undervaluation based on cash flows. The company reported a substantial earnings increase for Q1 2026 with net income rising to TWD 5,548.63 million from TWD 1,898.22 million the previous year. Despite forecasted annual earnings growth of 38.7%, which surpasses the Taiwan market average, its dividend yield of 3.23% isn't well-supported by free cash flows.
- Our expertly prepared growth report on WPG Holdings implies its future financial outlook may be stronger than recent results.
- Delve into the full analysis health report here for a deeper understanding of WPG Holdings.
Seize The Opportunity
- Unlock our comprehensive list of 217 Undervalued Asian Stocks Based On Cash Flows by clicking here.
- Invested in any of these stocks? Simplify your portfolio management with Simply Wall St and stay ahead with our alerts for any critical updates on your stocks.
- Enhance your investing ability with the Simply Wall St app and enjoy free access to essential market intelligence spanning every continent.
Contemplating Other Strategies?
- Explore high-performing small cap companies that haven't yet garnered significant analyst attention.
- Diversify your portfolio with solid dividend payers offering reliable income streams to weather potential market turbulence.
- Fuel your portfolio with companies showing strong growth potential, backed by optimistic outlooks both from analysts and management.
This article by Simply Wall St is general in nature. We provide commentary based on historical data and analyst forecasts only using an unbiased methodology and our articles are not intended to be financial advice. It does not constitute a recommendation to buy or sell any stock, and does not take account of your objectives, or your financial situation. We aim to bring you long-term focused analysis driven by fundamental data. Note that our analysis may not factor in the latest price-sensitive company announcements or qualitative material. Simply Wall St has no position in any stocks mentioned.
Have feedback on this article? Concerned about the content? Get in touch with us directly. Alternatively, email editorial-team@simplywallst.com