


European Dividend Stocks To Enhance Your Portfolio
The European market has recently seen a positive shift, with the pan-European STOXX Europe 600 Index reaching new highs, bolstered by strong corporate earnings and a recovery in AI-related stocks. In this dynamic environment, dividend stocks can offer stability and income potential, making them an attractive option for investors looking to enhance their portfolios amidst fluctuating market conditions.
Top 10 Dividend Stocks In Europe
| Name | Dividend Yield | Dividend Rating |
| Zurich Insurance Group (SWX:ZURN) | 4.08% | ★★★★★★ |
| UNIQA Insurance Group (WBAG:UQA) | 4.00% | ★★★★★☆ |
| Telekom Austria (WBAG:TKA) | 4.17% | ★★★★★★ |
| Swiss Re (SWX:SREN) | 4.78% | ★★★★★★ |
| Rubis (ENXTPA:RUI) | 6.19% | ★★★★★★ |
| Iren (BIT:IRE) | 5.46% | ★★★★★★ |
| Hannover Rück (XTRA:HNR1) | 4.98% | ★★★★★★ |
| Edel SE KGaA (XTRA:EDL) | 6.25% | ★★★★★★ |
| d'Amico International Shipping (BIT:DIS) | 4.85% | ★★★★★☆ |
| Cembra Money Bank (SWX:CMBN) | 5.12% | ★★★★★★ |
Click here to see the full list of 191 stocks from our Top European Dividend Stocks screener.
Let's explore several standout options from the results in the screener.
Anima Holding (BIT:ANIM)
Simply Wall St Dividend Rating: ★★★★★☆
Overview: Anima Holding S.p.A. is a publicly owned investment manager with a market cap of €2.35 billion.
Operations: Anima Holding S.p.A. generates its revenue primarily from its Asset Management segment, which accounted for €1.41 billion.
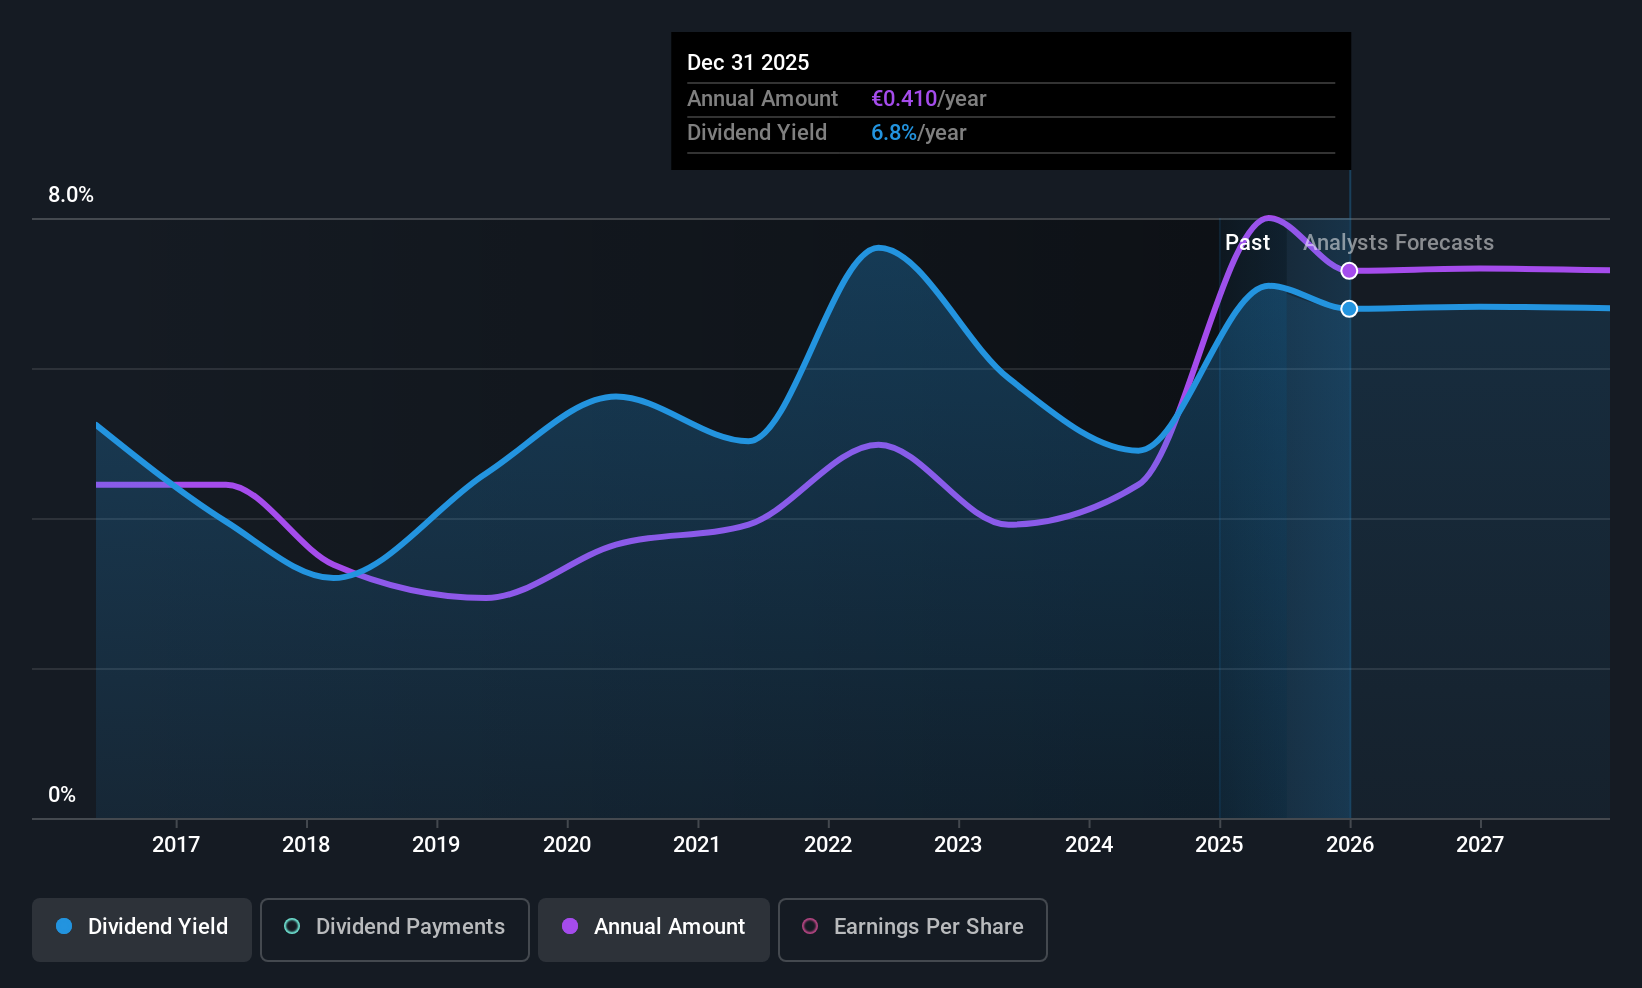
Dividend Yield: 6.9%
Anima Holding's dividend is well supported by both earnings and cash flows, with payout ratios of 63.6% and 39.7% respectively. Despite a strong dividend yield of 6.91%, among the top in Italy, its historical volatility raises concerns about reliability. Recent earnings for H1 2026 showed growth in sales (€222.5 million) and revenue (€286.8 million), but future earnings are expected to decline slightly, potentially impacting dividend sustainability over time.
- Get an in-depth perspective on Anima Holding's performance by reading our dividend report here.
- In light of our recent valuation report, it seems possible that Anima Holding is trading behind its estimated value.
ABN AMRO Bank (ENXTAM:ABN)
Simply Wall St Dividend Rating: ★★★★☆☆
Overview: ABN AMRO Bank N.V. offers a range of banking products and financial services to retail, private, and corporate clients across the Netherlands and internationally, with a market cap of €32.17 billion.
Operations: ABN AMRO Bank N.V.'s revenue segments include Corporate Banking (€3.05 billion), Wealth Management (€1.74 billion), and Personal & Business Banking (€4.02 billion).
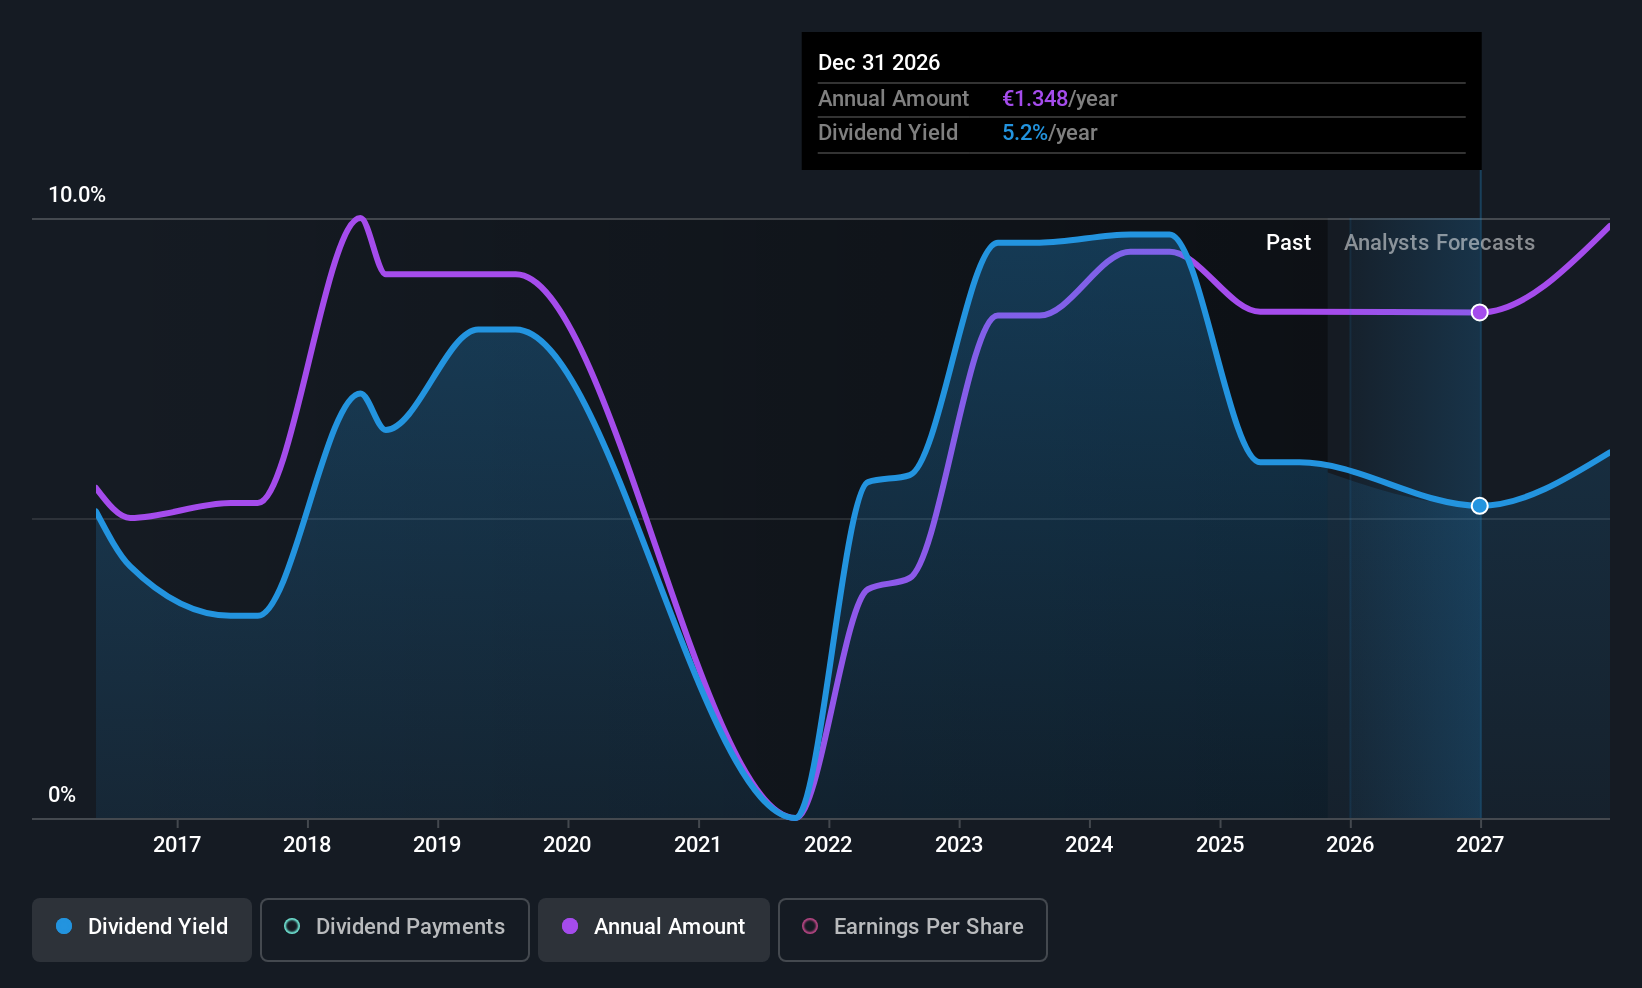
Dividend Yield: 3.1%
ABN AMRO Bank's dividend payments are currently covered by earnings with a payout ratio of 48.6%, and this is expected to remain sustainable in the future. However, its dividend history has been volatile and unreliable over the past decade, despite recent increases. The bank's special dividend of €0.30 per share reflects its commitment to returning capital to shareholders following solid Q1 2026 results, including net income growth to €692 million from €619 million a year ago.
- Take a closer look at ABN AMRO Bank's potential here in our dividend report.
- Our valuation report here indicates ABN AMRO Bank may be overvalued.
Newag (WSE:NWG)
Simply Wall St Dividend Rating: ★★★★☆☆
Overview: Newag S.A., along with its subsidiaries, is engaged in the production and sale of railway locomotives and rolling stock both in Poland and internationally, with a market cap of PLN4.10 billion.
Operations: Newag S.A. generates revenue primarily from repair services, modernization of rolling stock, and the production of rolling stock and control systems, amounting to PLN2.48 billion.
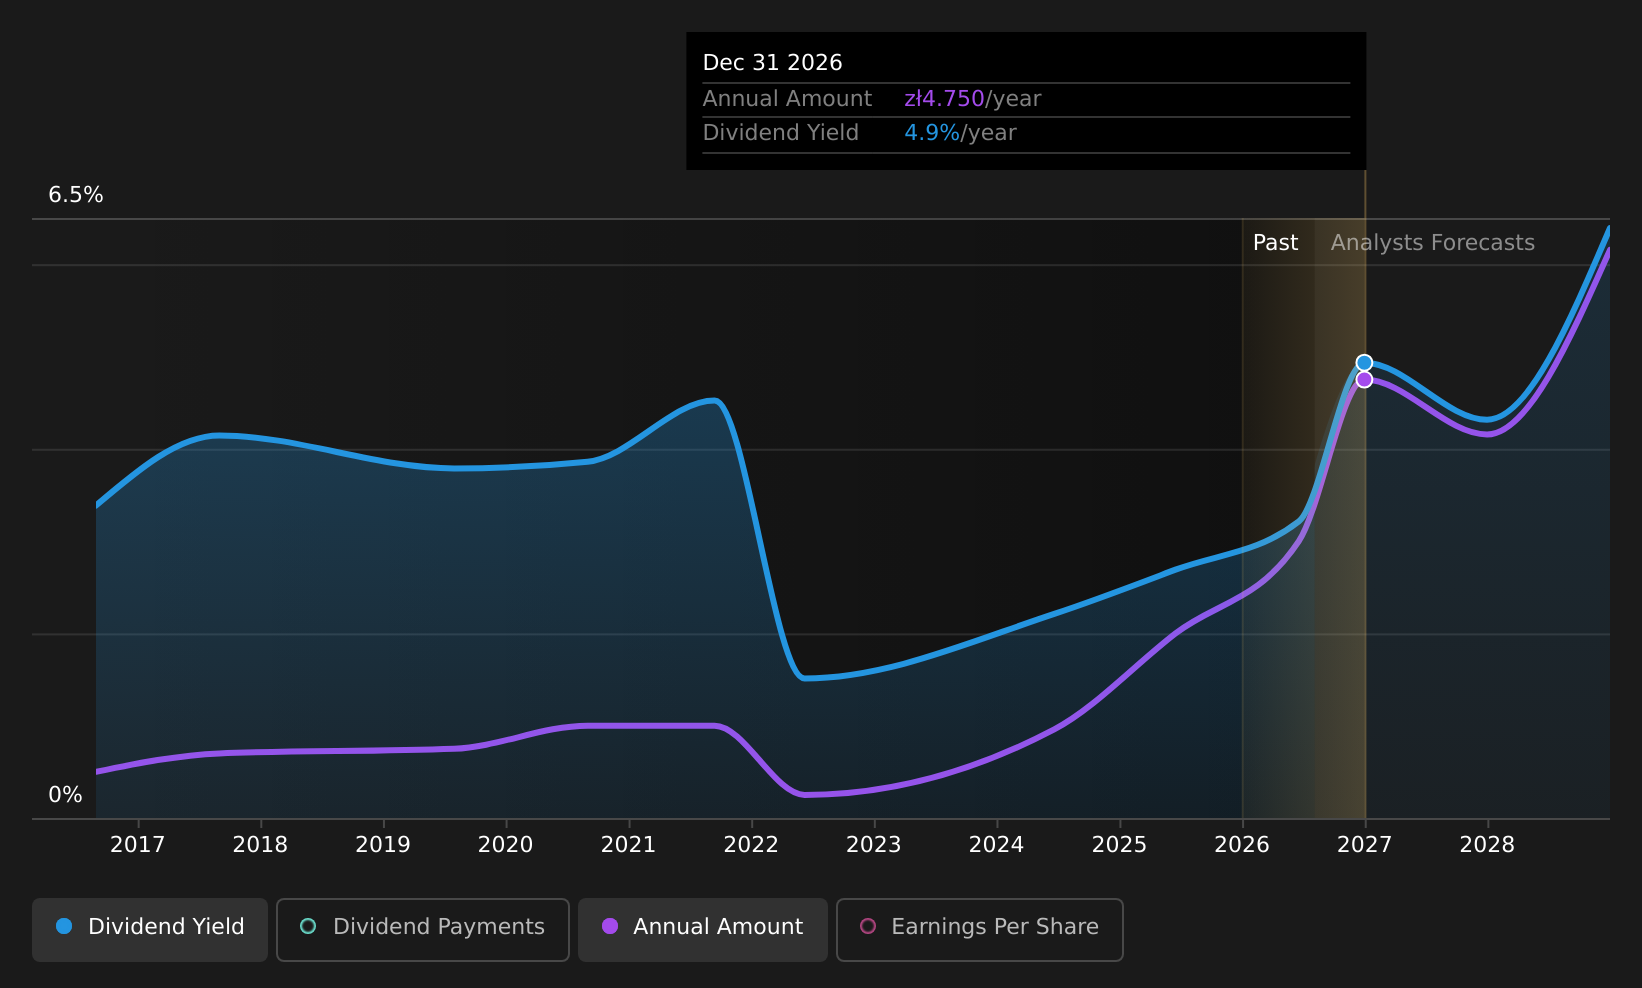
Dividend Yield: 3.3%
Newag's recent dividend increase to PLN 3.00 per share reflects its improving financial performance, with Q1 2026 net income rising to PLN 57.91 million from PLN 52.3 million the previous year. Despite a historically volatile dividend track record, the current payout is well-covered by earnings and cash flows, with ratios of 37.3% and 44.1%, respectively. Trading at a price-to-earnings ratio of 11.3x, Newag offers value compared to the Polish market average of 13.4x.
- Navigate through the intricacies of Newag with our comprehensive dividend report here.
- Our expertly prepared valuation report Newag implies its share price may be lower than expected.
Summing It All Up
- Discover the full array of 191 Top European Dividend Stocks right here.
- Invested in any of these stocks? Simplify your portfolio management with Simply Wall St and stay ahead with our alerts for any critical updates on your stocks.
- Streamline your investment strategy with Simply Wall St's app for free and benefit from extensive research on stocks across all corners of the world.
Ready To Venture Into Other Investment Styles?
- Explore high-performing small cap companies that haven't yet garnered significant analyst attention.
- Fuel your portfolio with companies showing strong growth potential, backed by optimistic outlooks both from analysts and management.
- Find companies with promising cash flow potential yet trading below their fair value.
This article by Simply Wall St is general in nature. We provide commentary based on historical data and analyst forecasts only using an unbiased methodology and our articles are not intended to be financial advice. It does not constitute a recommendation to buy or sell any stock, and does not take account of your objectives, or your financial situation. We aim to bring you long-term focused analysis driven by fundamental data. Note that our analysis may not factor in the latest price-sensitive company announcements or qualitative material. Simply Wall St has no position in any stocks mentioned.
Have feedback on this article? Concerned about the content? Get in touch with us directly. Alternatively, email editorial-team@simplywallst.com